. 2021 Aug 2;27(15):4265–4276. doi: 10.1158/1078-0432.CCR-20-4314

Figure 4.

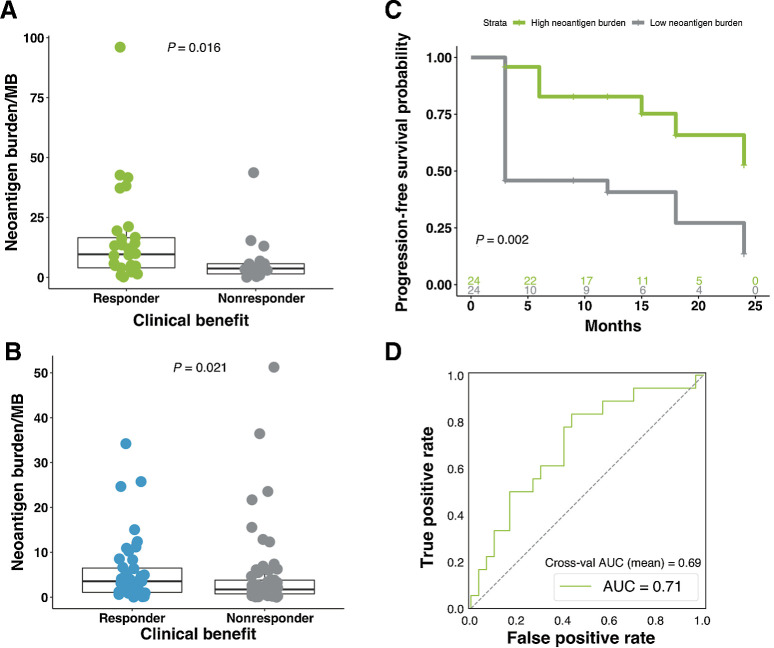
Figure 4. Neoantigen burden is associated with response to therapy. A, Neoantigen burden is significantly higher in responding patients compared with nonresponding patients (n = 48; MWW; P = 0.016). Boxplot covers the IQR from the 25th percentile at its lower bound to the 75th percentile at its upper bound, with median indicated by a horizontal line. The upper whisker includes the largest value within 1.5× IQR above the 75th percentile. The lower whisker includes the smallest value within 1.5× IQR below the 25th percentile. B, Similar findings were observed in the validation cohort, with patients who responded to therapy presenting significantly higher neoantigen burden (MWW; P = 0.021). C, Significantly longer PFS was observed in patients with high neoantigen burden when compared with those with low neoantigen burden (two-sided KM log-rank test; P = 0.002). D, AUROC for the neoantigen model was 0.71, and the cross-validation AUROC mean was 0.69 (log-likelihood ratio P = 0.0329).

Neoantigen burden is associated with response to therapy. A, Neoantigen burden is significantly higher in responding patients compared with nonresponding patients (n = 48; MWW; P = 0.016). Boxplot covers the IQR from the 25th percentile at its lower bound to the 75th percentile at its upper bound, with median indicated by a horizontal line. The upper whisker includes the largest value within 1.5× IQR above the 75th percentile. The lower whisker includes the smallest value within 1.5× IQR below the 25th percentile. B, Similar findings were observed in the validation cohort, with patients who responded to therapy presenting significantly higher neoantigen burden (MWW; P = 0.021). C, Significantly longer PFS was observed in patients with high neoantigen burden when compared with those with low neoantigen burden (two-sided KM log-rank test; P = 0.002). D, AUROC for the neoantigen model was 0.71, and the cross-validation AUROC mean was 0.69 (log-likelihood ratio P = 0.0329).