. 2021 Aug 2;27(15):4265–4276. doi: 10.1158/1078-0432.CCR-20-4314

Figure 6.

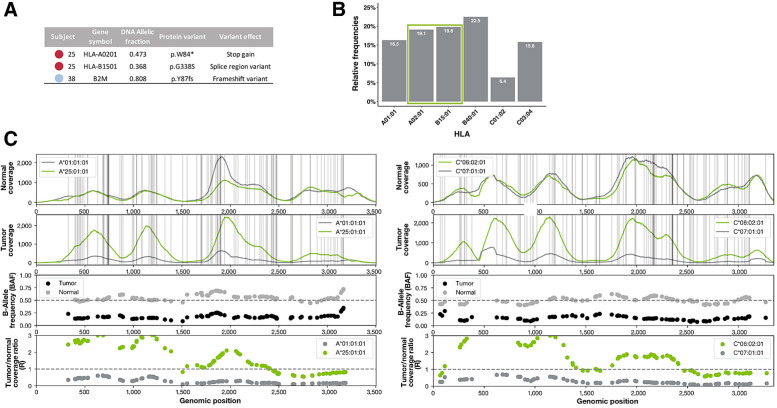
Figure 6. Changes to APM that may contribute to immune evasion. A, Somatic HLA mutations detected in patient 25 may lead to the loss of surface expression of HLA-A02:01 and possible misfolding of HLA-B15:01. A damaging frameshift variant was detected in B2M in patient 38, possibly impairing all MHC class I presentation in that patient. B, 38.9% of neoantigens predicted to be presented by patient 25 are predicted to bind to the damaged alleles described in A. C, Four panels showing the NGS sequence-based evidence for HLA LOH in HLA-A and HLA-C of patient 54. HLA-B is not shown. The first row shows the raw read coverage of both homologous alleles in the normal sample. The second row shows the raw read coverage of both homologous alleles in the tumor sample. Both plots have vertical gray lines representing the positions of difference between the two alleles. Because of strict mapping parameters requiring all reads to map without mismatch, differences in coverage at the gray lines represent true differences in coverage between the alleles. The third panel shows the BAF from the normal sample (gray) and the tumor sample (black). The BAF in the tumor sample must be considered in light of the BAF in the normal sample because of primer hybridization differences between the alleles. The fourth panel shows the ratio in coverage between the tumor and normal samples for each allele. These values have been normalized by the tumor and normal read depth across the whole exome. The expected value with no copy-number change is 1, shown with a dashed gray line. Both the third and fourth panel show data only for the mismatch positions between the two alleles.

Changes to APM that may contribute to immune evasion. A, Somatic HLA mutations detected in patient 25 may lead to the loss of surface expression of HLA-A02:01 and possible misfolding of HLA-B15:01. A damaging frameshift variant was detected in B2M in patient 38, possibly impairing all MHC class I presentation in that patient. B, 38.9% of neoantigens predicted to be presented by patient 25 are predicted to bind to the damaged alleles described in A. C, Four panels showing the NGS sequence-based evidence for HLA LOH in HLA-A and HLA-C of patient 54. HLA-B is not shown. The first row shows the raw read coverage of both homologous alleles in the normal sample. The second row shows the raw read coverage of both homologous alleles in the tumor sample. Both plots have vertical gray lines representing the positions of difference between the two alleles. Because of strict mapping parameters requiring all reads to map without mismatch, differences in coverage at the gray lines represent true differences in coverage between the alleles. The third panel shows the BAF from the normal sample (gray) and the tumor sample (black). The BAF in the tumor sample must be considered in light of the BAF in the normal sample because of primer hybridization differences between the alleles. The fourth panel shows the ratio in coverage between the tumor and normal samples for each allele. These values have been normalized by the tumor and normal read depth across the whole exome. The expected value with no copy-number change is 1, shown with a dashed gray line. Both the third and fourth panel show data only for the mismatch positions between the two alleles.