
Figure 1.
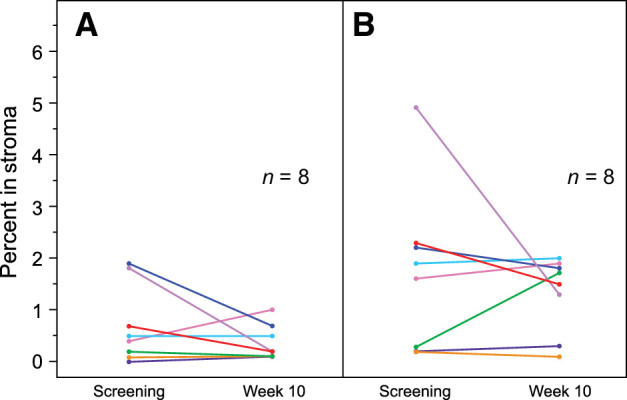
Expression of stromal CCR4+FoxP3+ and FoxP3+ cells in tumor stroma. A and B, The percentage of CCR4+FoxP3+ double-positive (A) and FoxP3+ single-positive stromal cells (B) at screening and at week 10.
Official websites use .gov
A
.gov website belongs to an official
government organization in the United States.
Secure .gov websites use HTTPS
A lock (
) or https:// means you've safely
connected to the .gov website. Share sensitive
information only on official, secure websites.
Expression of stromal CCR4+FoxP3+ and FoxP3+ cells in tumor stroma. A and B, The percentage of CCR4+FoxP3+ double-positive (A) and FoxP3+ single-positive stromal cells (B) at screening and at week 10.