. 2021 Nov 9;28(3):479–488. doi: 10.1158/1078-0432.CCR-21-2781

Figure 3.

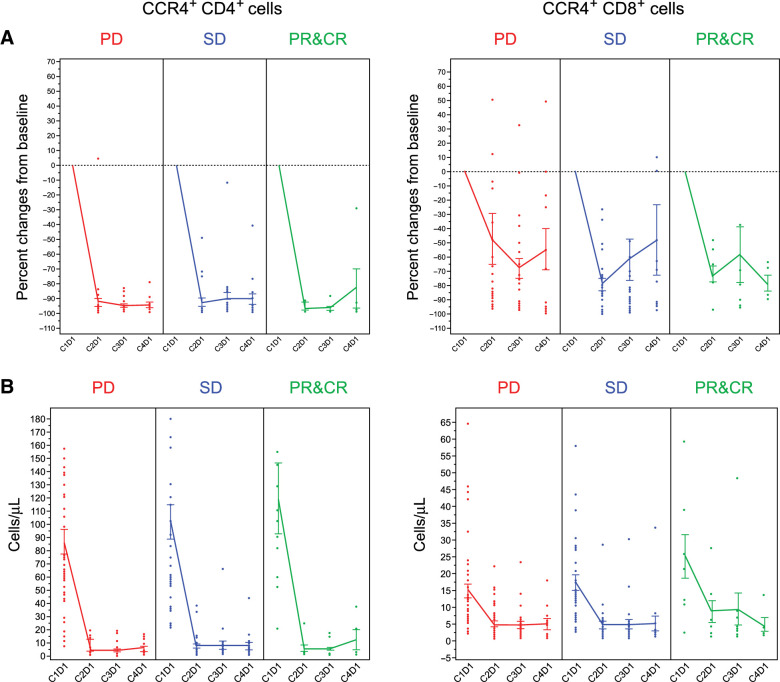
Figure 3. Peripheral blood CCR4+ CD4 and CD8 cells. The percent change from baseline (A) and actual cell count (B) determined from flow cytometric analysis of peripheral blood CD4 and CD8 cell populations were determined prior to administration of drug at cycle 1 day 1 (C1D1), C2D1, C3D1, and C4D1. CR, complete response; PD, progressive disease; PR, partial response; SD, stable disease.

Peripheral blood CCR4+ CD4 and CD8 cells. The percent change from baseline (A) and actual cell count (B) determined from flow cytometric analysis of peripheral blood CD4 and CD8 cell populations were determined prior to administration of drug at cycle 1 day 1 (C1D1), C2D1, C3D1, and C4D1. CR, complete response; PD, progressive disease; PR, partial response; SD, stable disease.