Figure 4.
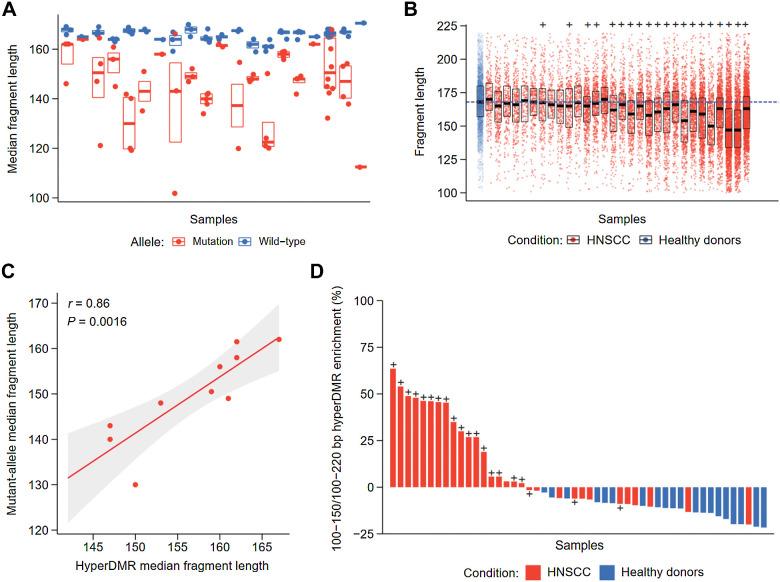
Fragment length analysis between CAPP-seq and cfMeDIP-seq profiles. A, Median fragment length of detected mutations across patients with HNSCC by CAPP-seq. For each patient, the median fragment length of each mutation and matched reference allele was measured. The distribution of median fragment length for each mutation or matched reference allele is shown per patient. Black bar: median of fragment lengths. Box: IQR of fragment lengths. In cases with a single mutation, the colored line denotes the median length of fragments containing the mutation or matched reference allele, respectively. B, Fragment length distributions within HNSCC hypermethylated regions by cfMeDIP-seq. Fragment lengths from healthy controls were pooled prior to analysis, where each subsequent box denotes an individual HNSCC cfMeDIP-seq profile. + symbols denote HNSCC patients with detectable ctDNA by CAPP-seq (CAPP-seq positive). Black bar: median of fragment lengths. Box: IQR of fragment lengths. Individual HNSCC samples are ordered on the basis of increasing mean methylation (RPKM) within the hypermethylated regions. Dashed blue line defines the median fragment length across all healthy controls. C, Comparison of median fragment lengths from CAPP-seq and cfMeDIP-seq profiles. Points define individual HNSCC samples with methylation values above the median (n = 10). Solid red line: fitted linear regression model. Gray boundaries: 95% CI. D, Ratio of enrichment for hyper-DMR regions by fragments between 100 and 150 bp compared with enrichment for hyper-DMR regions by fragments between 100 and 220 bp. + symbols denote patients with HNSCC with detectable ctDNA by CAPP-seq (CAPP-seq positive).

