. 2021 Jun 22;27(15):4230–4244. doi: 10.1158/1078-0432.CCR-21-0110

Figure 6.

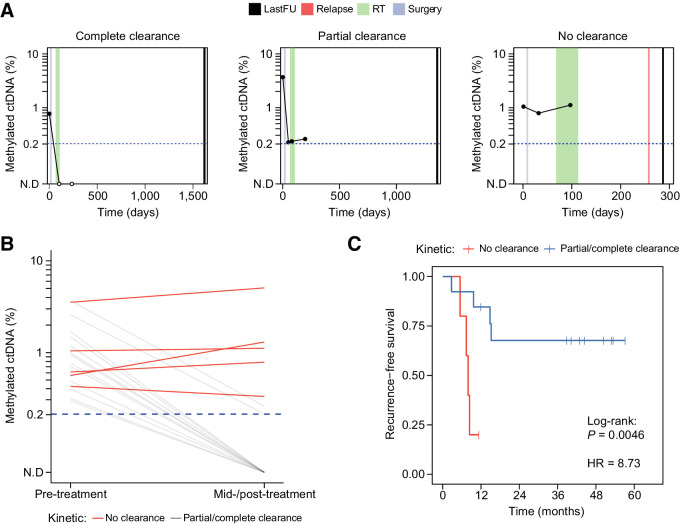
Figure 6. Clinical utility of ctDNA detection by cfMeDIP-seq for longitudinal monitoring. A, Representative ctDNA kinetics throughout treatment that were observed in this study. Complete clearance was defined as a change from detected ctDNA at diagnosis to a decrease in ctDNA abundance below the detection threshold (i.e., 0.2%) at first available mid-/post-treatment timepoint. Partial clearance was defined as an observed ≥90% decrease in ctDNA abundance from diagnosis compared with last follow-up. No clearance was defined as an observed <90% decrease or ≥0% increase in ctDNA from diagnosis to last follow-up. lastFU = sample collection at last follow-up, RT = radiotherapy. B, Changes in ctDNA abundance pre-treatment (baseline) to first available mid-/post-treatment timepoint across patients with HNSCC (n = 30). Red lines denote patients who demonstrated kinetics of no clearance, whereas gray lines denote patients with kinetics of clearance/partial clearance. C, Kaplan–Meier analysis depicting recurrence-free survival. Patients were stratified on the basis of kinetics of clearance (i.e., no clearance versus clearance/partial clearance).

Clinical utility of ctDNA detection by cfMeDIP-seq for longitudinal monitoring. A, Representative ctDNA kinetics throughout treatment that were observed in this study. Complete clearance was defined as a change from detected ctDNA at diagnosis to a decrease in ctDNA abundance below the detection threshold (i.e., 0.2%) at first available mid-/post-treatment timepoint. Partial clearance was defined as an observed ≥90% decrease in ctDNA abundance from diagnosis compared with last follow-up. No clearance was defined as an observed <90% decrease or ≥0% increase in ctDNA from diagnosis to last follow-up. lastFU = sample collection at last follow-up, RT = radiotherapy. B, Changes in ctDNA abundance pre-treatment (baseline) to first available mid-/post-treatment timepoint across patients with HNSCC (n = 30). Red lines denote patients who demonstrated kinetics of no clearance, whereas gray lines denote patients with kinetics of clearance/partial clearance. C, Kaplan–Meier analysis depicting recurrence-free survival. Patients were stratified on the basis of kinetics of clearance (i.e., no clearance versus clearance/partial clearance).