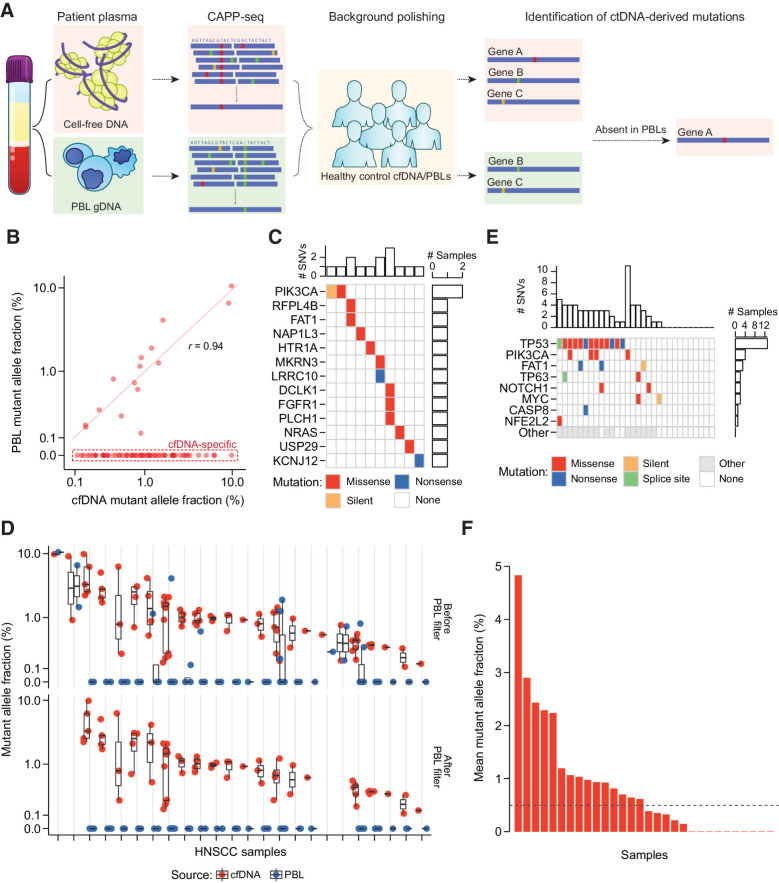
Figure 2.
PBL filtering for detection of ctDNA by CAPP-seq. A, Schematic describing detection and filtering of ctDNA-derived mutations by CAPP-seq. B, MAF of candidate mutations identified in HNSCC patient baseline plasma and PBLs. Dashed red box: 69 of 84 candidate mutations found only in plasma. Mutations found in both matched plasma and PBLs have strongly correlated MAFs (Pearson r = 0.94). C, Oncoprint of 15 candidate mutations identified in both matched patient plasma and PBLs. Top histogram: number of mutations per patient; right histogram: number of patients with one of 13 specified genes mutated. Color indicates type of mutation: missense (red), nonsense (blue), or silent (orange). D, MAF of 69 candidate mutations across HNSCC patient cfDNA (red circle) and PBLs (blue circle) before removal of PBL-associated mutations, and 43 mutations after this removal. The removed mutations represent false positive candidate mutations in ctDNA. Black bar: median of expected overlaps. Box: interquartile range (IQR) of expected overlaps. Whisker: most extreme value within quartile ±1.5 IQR of expected overlaps. E, Oncoprint highlighting frequently mutated genes in HNSCC by TCGA analysis (rows) and their frequency of detection across 30 HNSCC plasma samples (columns). Colors as in B, with additional splice sites (green), and nonhighlighted genes (gray). F, Mutation-based ctDNA levels in HNSCC patient baseline plasma samples as determined by mean MAF of PBL-filtered mutations. Dashed line: median mean allele fraction across all patients with HNSCC.

