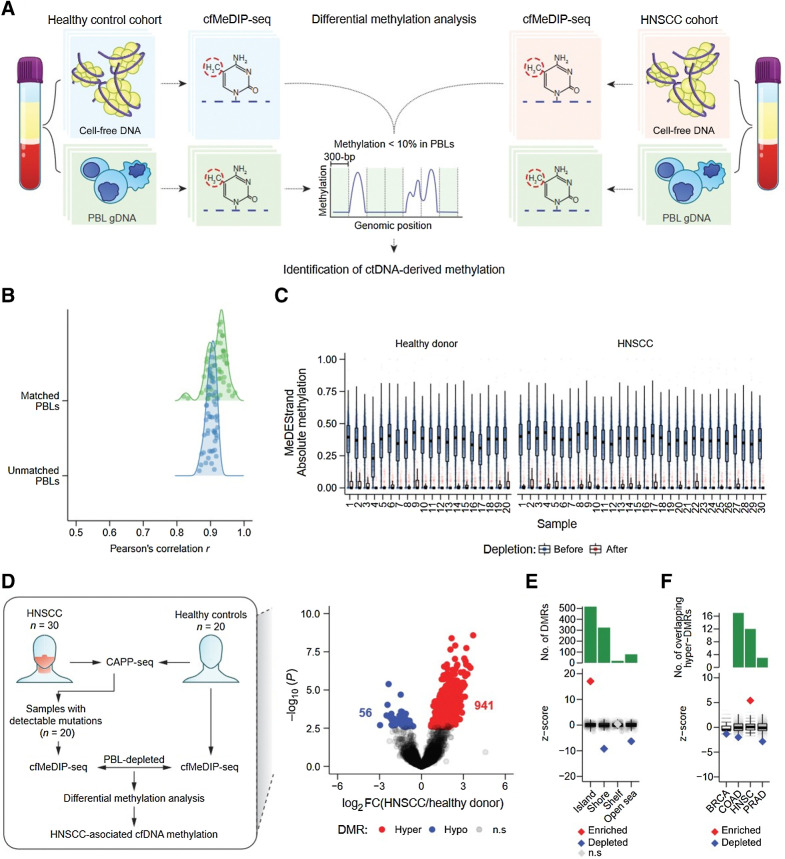
Figure 3.
Identification of informative regions for detection of ctDNA by cfMeDIP-seq. A, Schematic of ctDNA-derived methylation detection by DMR analysis following depletion of PBL-derived DNA methylation. B, Kernel density of Pearson correlation coefficients from the comparison between all 50 (patients and healthy controls) baseline cfDNA cfMeDIP-seq profiles (RPKM values within 702,488 300-bp nonoverlapping windows from chromosomes 1–22 with ≥8 CpGs) and either unmatched PBL gDNA (1 vs. 49 comparisons) or matched PBL gDNA (1 vs. 1 comparison) MeDIP-seq profiles. C, MeDEStrand absolute methylation scores in the 702,488 300-bp windows from 20 healthy controls (left) and 30 HNSCC samples (right). Blue: 702,488 windows before PBL depletion. Red: 99,994 windows after both PBL depletion and an additional filter where the median absolute methylation across healthy control PBLs is < 0.1. Black bar: median. Box: IQR. Whisker: most extreme value within quartile ±1.5 IQR. Blue/red circles: individual MeDEStrand absolute methylation scores across windows ≥8 CpGs and PBL-depleted windows, respectively. Absoluate methylation scores were subsampled to a total of 100,000 observations for clarity. D, Left, Workflow of ctDNA detection by differential methylation analysis of HNSCC and healthy control cfMeDIP-seq profiles. We compared cfMeDIP-seq profiles from 20 patients with HNSCC with detectable mutations by CAPP-seq to 20 risk-matched healthy controls within the PBL-depleted windows for each sample. This procedure identified HNSCC-associated cfDNA methylation. Right, Volcano plot of 79,043 genomic regions, with > 10 reads across all samples, displaying −log10P value of differential methylation against log2 fold change of relative methylation (RPKMs) from healthy controls to patients with HNSCC. Gray: regions without significant differential methylation (FDR ≥10%). Blue: 56 hypomethylated 300-bp regions, with significantly lower methylation in the HNSCC cohort compared to healthy controls. Red: 941 300-bp hypermethylated regions, with significantly higher methylation in the HNSCC cohort. E, Permutation analysis measuring the observed overlap of the 941 300-bp hypermethylated regions to 300-bp windows within CpG islands, shores, shelves, or open seas, relative to a distribution of the expected overlap generated by random sampling of the genome. F, Permutation analysis measuring the observed overlap of the 941 300-bp hypermethylated regions to hypermethylated regions within tumor-specific methylated cytosines from TCGA (n = 10,000 permutations total). BRCA: breast invasive carcinoma; COAD: colon adenocarcinoma; HNSC: head and neck squamous cell carcinoma; PRAD: prostate adenocarcinoma. E and F, The expected overlap from 1,000 random samples was transformed to a Z-score distribution (gray circles) and used to calculate the Z-score of the observed overlap (diamond). P values were calculated based on the probability of the observed overlap relative to the distribution generated from the expected overlaps. Red: significant enrichment, P < 0.05. Blue: significant depletion, P < 0.05. Gray: nonsignificant. Black bar: median of expected overlaps. Box: IQR of expected overlaps. Whisker: most extreme value within quartile ±1.5 IQR of expected overlaps. Above: histogram of number of DMRs for each CpG geography.

