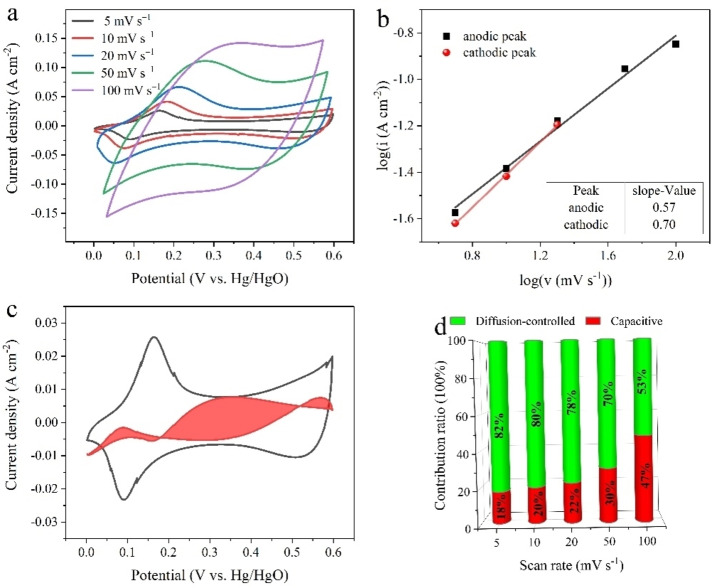
Figure 4.
(a) CV curves of the Co‐MOF/CFC electrode at the scan rates ranging from 5 to 100 mV s−1. (b) Determination of b value using the relationship between peak current and scan rate. (c) Capacitive contribution (red area) at 5 mV s−1. (d) Contribution ratio of surface‐limited process and diffusion‐limited process at different scan rate

