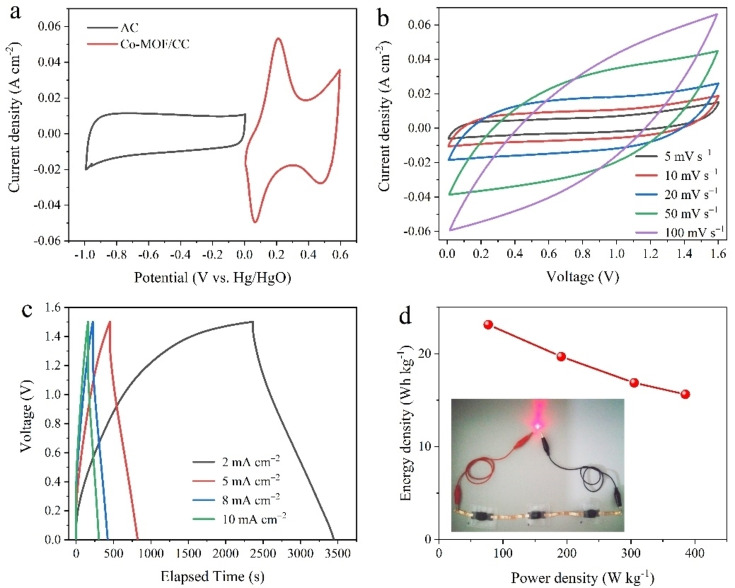
Figure 6.
(a) CV curves for Co‐MOF/CFC and AC collected in different potential windows at a scan rate of 10 mV s−1. (b) CV curves of the Co‐MOF/CFC//AC ASSC device at various scan rates from 10 to100 mV s−1 over the 1.6 V potential window. (c) Galvanostatic charge‐discharge curves of the ASSC device at different current densities. (d) Ragone plot of the Co‐MOF/CFC//AC ASSC device. The inset is a digital photograph of a red LED powered by three ASSC devices connected in series.

