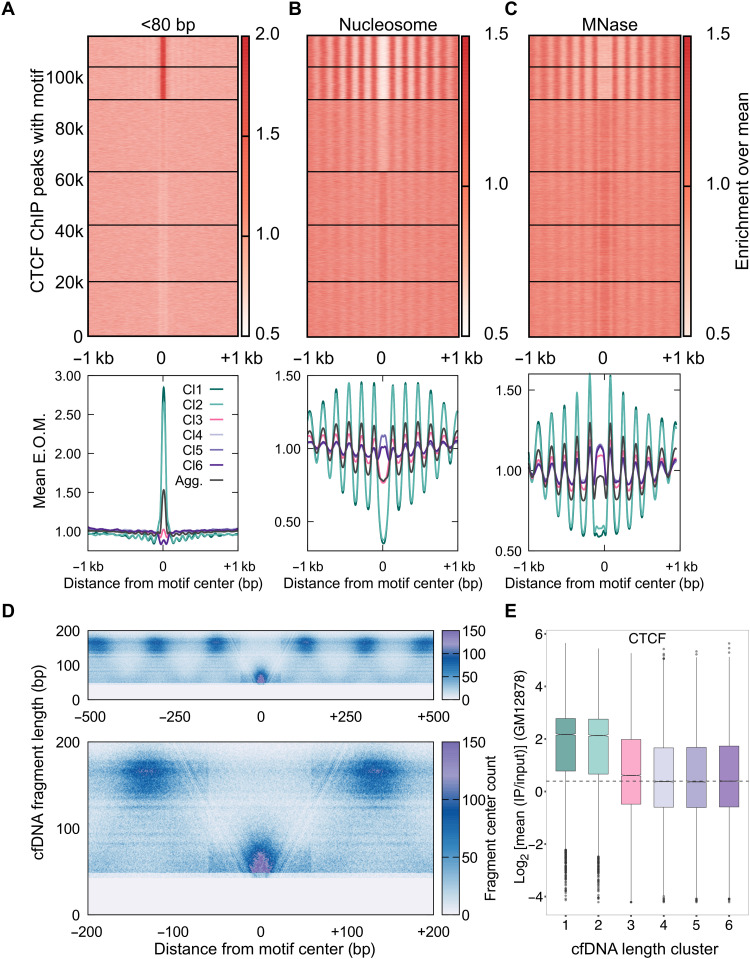
Fig. 2. cfDNA maps CTCF-nucleosome dynamics in plasma from a healthy individual.
(A) Enrichment over the mean signal in TFBS ± 1 kb of cfDNA short (<80 bp) fragments is plotted as a heatmap (top) (117,144 CTCF TFBS) and as metaplots for each cluster (bottom). E.O.M., enrichment over mean. (B) Same as (A) for nucleosome-sized fragments (130 to 180 bp). (C) Same as (B) for MNase-seq dataset from GM12878 cells. (D) Fragment midpoint versus fragment length plot (V plot) of cfDNA fragments centered at CTCF binding sites from clusters 1 and 2. Fragment densities at motif center ± 500 bp (top) and motif center ± 200 bp (bottom) are plotted. (E) Boxplot of CTCF mean ChIP signal from the GM12878 cell line across length clusters. Number of sites (n) in length clusters and P value using Kolmogorov-Smirnov (KS) test with alternative = “greater” option are the following: Cl1: n = 11,978, P(1,6) < 2.2 × 10⁻¹⁶; Cl2: n = 12,811, P(2,6) < 2.2 × 10⁻¹⁶; Cl3: n = 28,132, P(3,6) = 1.1 × 10⁻³¹; Cl4: n = 20,839, P(4,6) = 0.95; Cl5: n = 22,087, P(5,6) = 0.96; Cl6: n = 21,297. P(a,b) denotes P values calculated between scores in length cluster a and scores in length cluster b.

