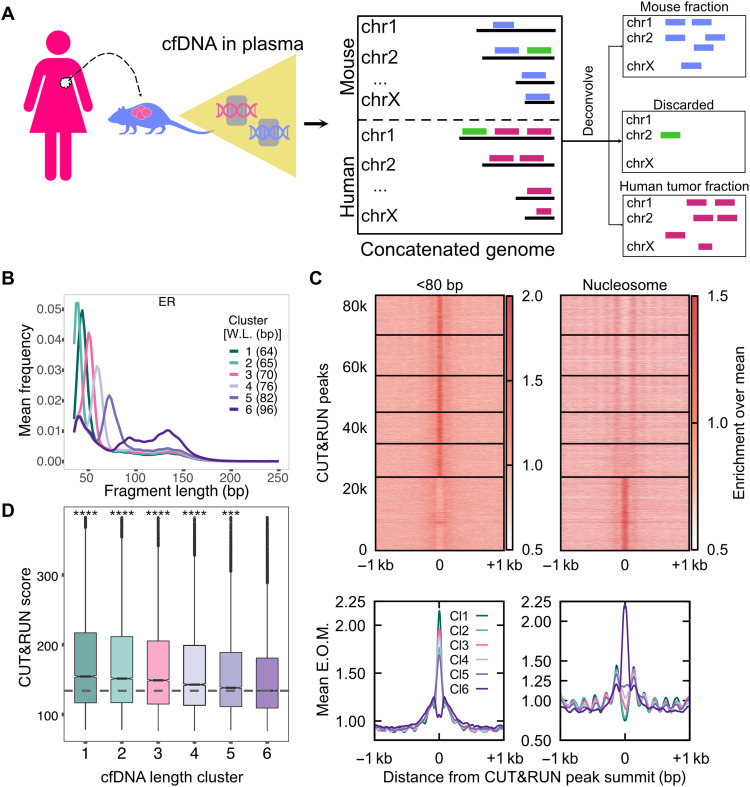
Fig. 4. ER+ breast cancer xenograft models enable identification of pure tumor cfDNA footprints for ER.
(A) Schematic of human cancer cell lines implanted in the mouse and the process of identifying tumor cfDNA by mapping mouse plasma cfDNA to an in silico concatenated genome. Fragments mapped uniquely to the human genome (violet lines) define tumor cfDNA (ctDNA). Fragments mapped uniquely to the mouse genome (blue lines) arise from the tumor microenvironment and from the mouse lymphoid/myeloid cells. Fragments mapped to both genomes were discarded (green lines). (B) Average length distributions at clusters of ER CUT&RUN peaks (summit ± 50 bp) generated by k-means clustering (n = 6) of the ctDNA fragment length distribution. (C) Enrichment over the mean signal in TFBS ± 1 kb of cfDNA short (<80 bp) fragments is plotted as a heatmap (top) (83,311 ER TFBS) and as metaplots for each cluster (bottom). (D) Boxplot of ER CUT&RUN scores for peak summits in k-means clusters. Number of sites (n) in length clusters and P value using KS test are the following: Cl1: n = 12,785, P(1,6) = 1.2 × 10−151; Cl2: n = 13,301, P(2,6) = 7.9 × 10−116; Cl3: n = 11,943, P(3,6) = 1.5 × 10−80; Cl4: n = 10,363, P(4,6) = 1.6 × 10−37; Cl5: n = 10,848, P(5,6) = 1.1 × 10⁻⁸; Cl6: n = 24,029. Significant string was determined after Bonferroni correction. ****P < 0.0001 and ***0.0001 < P < 0.001.

