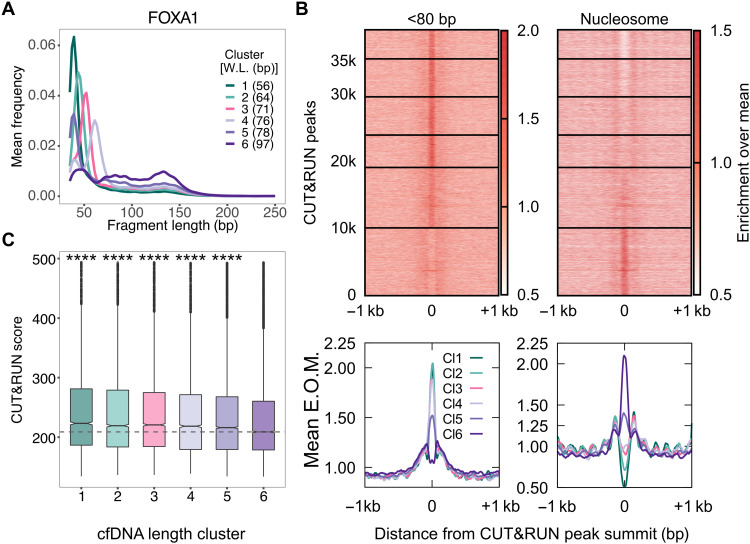
Fig. 5. ER+ breast cancer xenograft models enable identification of pure tumor cfDNA footprints for FOXA1.
(A) Average length distributions at clusters of FOXA1 CUT&RUN peaks (summit ± 50 bp) generated by k-means clustering (n = 6) of the ctDNA fragment length distribution. (B) Enrichment over the mean signal in TFBS ± 1 kb of cfDNA short (<80 bp) fragments is plotted as a heatmap (top) (39,500 FOXA1 TFBS) and as metaplots for each cluster (bottom). (C) Boxplot of FOXA1 CUT&RUN scores (see Materials and Methods) for peak summits in k-means clusters. P values from KS test. Number of sites (n) in length clusters and P value using KS test are the following: Cl1: n = 4220, P(1,6) = 3.4 × 10−36; Cl2: n = 5669, P(2,6) = 3.2 × 10⁻¹⁹; Cl3: n = 5699, P(3,6) = 4.5 × 10⁻¹⁵; Cl4: n = 4831, P(4,6) = 3.1 × 10⁻¹⁰; Cl5: n = 9033, P(5,6) = 3.9 × 10⁻¹⁰; Cl6: n = 10,017. Significant string was determined after Bonferroni correction. ****P < 0.0001.

