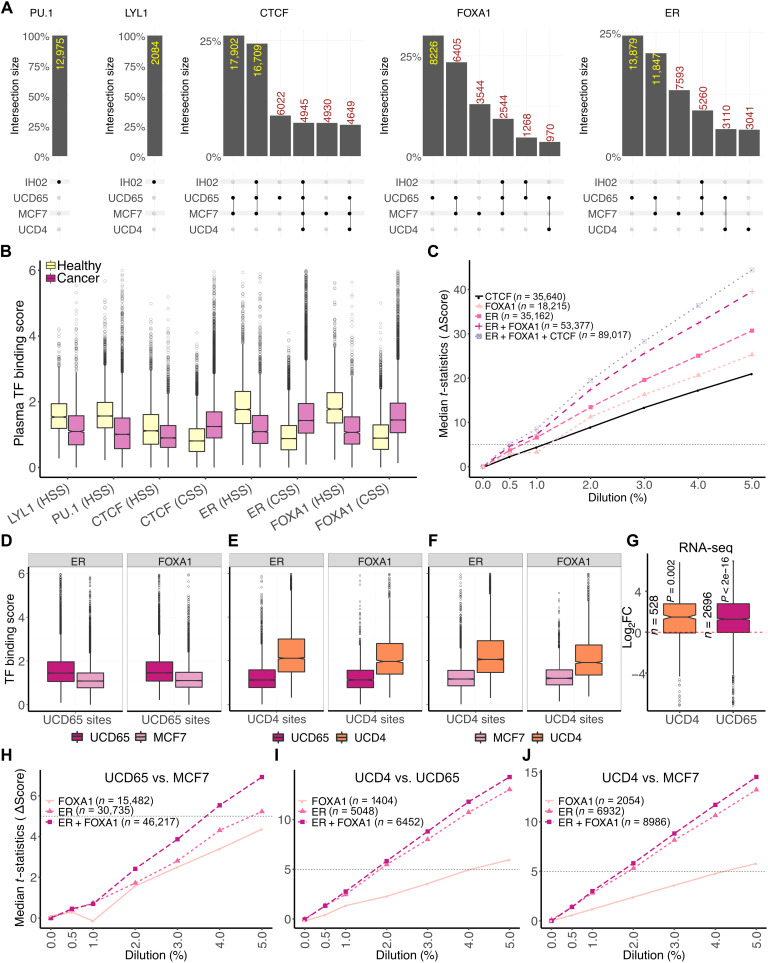
Fig. 6. Tissue-specific TFBSs enable detection of disease states.
(A) Upset plots (67) of cfDNA-inferred bound sites in different plasma samples for LYL1, PU.1, CTCF, FOXA1, and ER (left to right). Plots were generated using the ComplexUpset R package (DOI: 10.5281/zenodo.4661589). (B) Boxplots of TF binding scores measured as mean enrichment of short fragments at CUT&RUN peak summit ± 100 bp for ER and FOXA1 and motif center ± 50 bp for LYL1, PU.1, and CTCF. CSS, cancer-specific sites; HSS, healthy-specific sites. (C) Line plot of median t statistic calculated for change in the binding scores (score in healthy plasma used as baseline) at binding sites of an individual TF or a collection of TFs at different in silico dilutions of healthy cfDNA with PDX ctDNA. At each dilution, 100 bootstrapped samples were generated. Horizontal dashed line is drawn where the t statistic equals 5. (D) Boxplot of TF binding scores in pure ctDNA (UCD65/MCF7) at ER and FOXA1 sites specific to UCD65. (E) Boxplot of TF binding scores in pure ctDNA (UCD65/UCD4) at ER and FOXA1 sites specific to UCD4. (F) Boxplot of TF binding scores in pure ctDNA (MCF7/UCD4) at ER and FOXA1 sites specific to UCD4. (G) Boxplot of log2 fold change (Log2FC) between UCD4/UCD65 and MCF7 in expression of genes adjacent to sites specific to UCD4 and UCD65. (H) Line plot of median t statistic calculated for the change in TF binding scores at UCD65- or MCF7-specific ER, FOXA1, or ER and FOXA1 sites combined at different in silico dilutions of healthy cfDNA with PDX ctDNA. At each dilution, 100 bootstrapped samples were generated. A horizontal dashed line is drawn where the t statistic equals 5. (I) Same as (H) for UCD4-specific ER and FOXA1 sites against UCD65. (J) Same as (H) for UCD4-specific ER and FOXA1 sites against MCF7.

