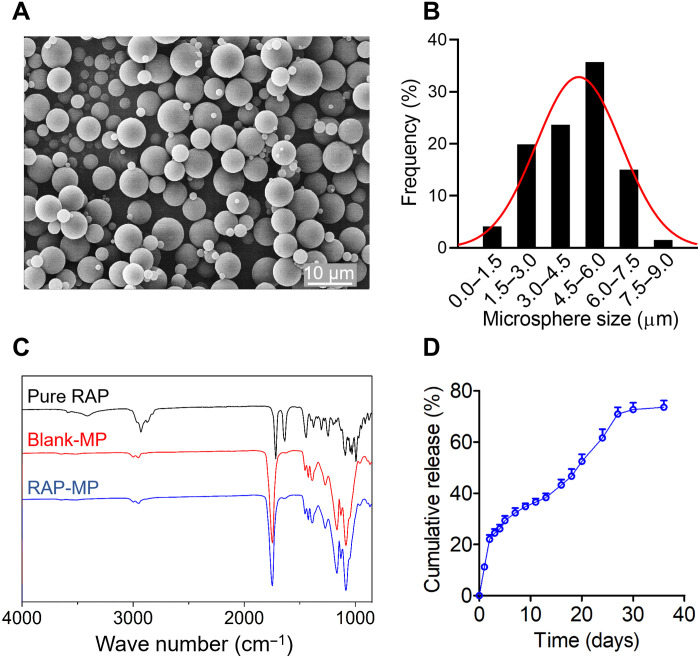
Fig. 1. Characterization of RAP-MPs.
(A) Representative SEM image of RAP-MPs. (B) Size distribution of RAP-MPs. More than 200 particles were measured. (C) FTIR of pure RAP powder (black line), blank-MPs (red line), and RAP-MPs (blue line). (D) In vitro release profile of RAP from RAP-MPs incubated in phosphate-buffered saline [PBS (pH 7.4) plus 1% Tween 20] at 37°C and 150 rpm. Samples (n = 3) were regularly collected over 35 days.

