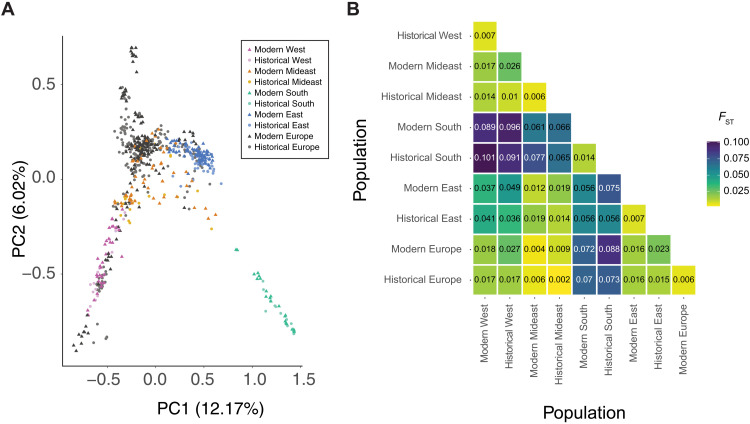
Fig. 1. Population structure in A. artemisiifolia.
(A) PCA of A. artemisiifolia samples. NA populations are defined on the basis of genetic clustering and geography. Dark pink, modern West NA; light pink, historical West NA; dark orange, modern Mideast NA; light orange, historical Mideast NA; dark turquoise, modern South NA; light turquoise, historical South NA; dark blue, modern East NA; light blue, historical East NA; dark gray, modern Europe; light gray, historical Europe. Circles, historical herbarium samples; triangles, contemporary samples. (B) Genetic structure estimated by pairwise FST (weighted) between native-range populations and Europe. Populations are split by time period (historical and modern). Shading of the boxes corresponds to the FST value, with yellow boxes indicating low FST and purple boxes indicating high FST.

