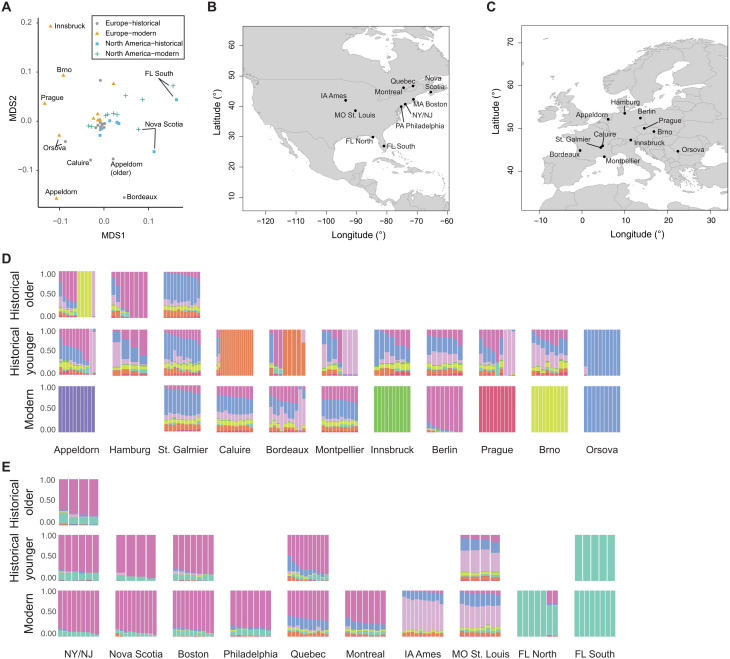
Fig. 3. Genetic structure of spatial groups.
(A) MDS plot of pairwise FST between spatial groups (stress = 0.17). Gray circles, historical Europe; orange triangles, modern Europe; blue squares, historical North America; green crosses, modern North America. (B) Location of spatial groups in North America. (C) Location of spatial groups in Europe. (D) Admixture barplots for K = 9 of European spatial groups. (E) Admixture barplots for K = 9 of NA spatial groups. If the spatial group was split into an older (collected before 1900) and younger (collected after 1900), then the top row shows the older historical time period, and the middle row shows the younger historical time period. Otherwise, the middle row shows the historical time period. Bottom row: Modern time period. For the admixture barplots, the same color scheme as in Fig. 2 was used. Admixture barplots are from a joint analysis run including all samples and were split into different panels.

