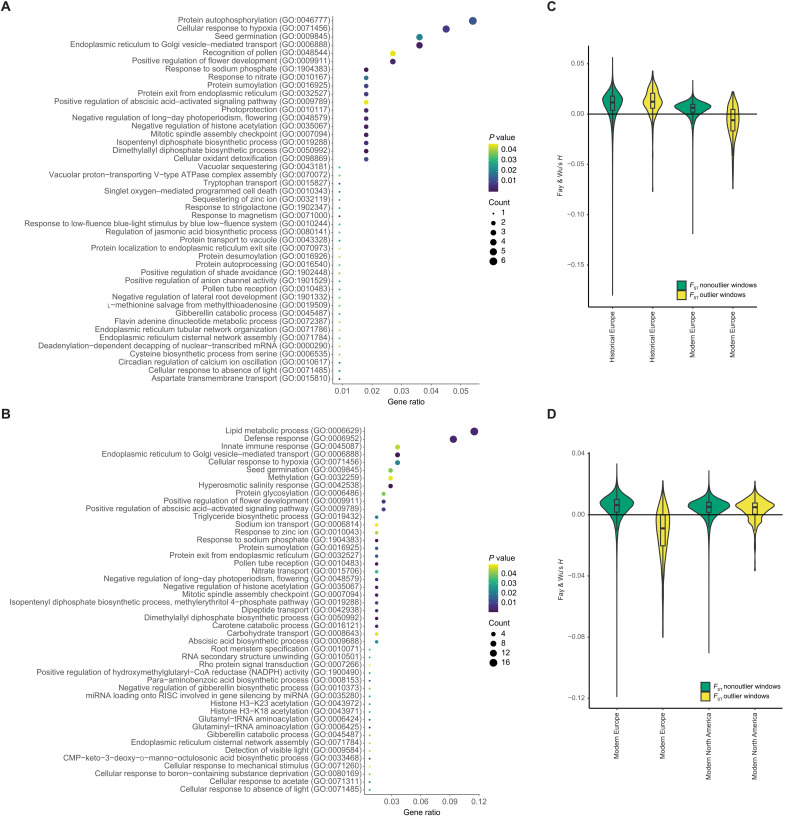
Fig. 5. Selection scan.
(A and B) Significantly enriched GO terms in the FST outlier windows. The size of the circles represents the number of significant genes annotated for the respective GO term. The color represents the P value for the enrichment, with yellow representing high and purple low P values. The gene ratio is the number of genes with significantly enriched GO terms in FST outlier windows divided by the total number of genes in FST outlier windows. (A) Enriched GO terms for historical versus modern Europe. (B) Enriched GO terms for modern Europe versus modern North America. (C and D) Fay and Wu’s H in FST outlier (yellow) and nonoutlier (green) windows. The boxplots show the median and first and third quantiles. (C) Outlier windows for FST between historical and modern Europe. (D) Outlier windows for FST between modern Europe and modern North America.

