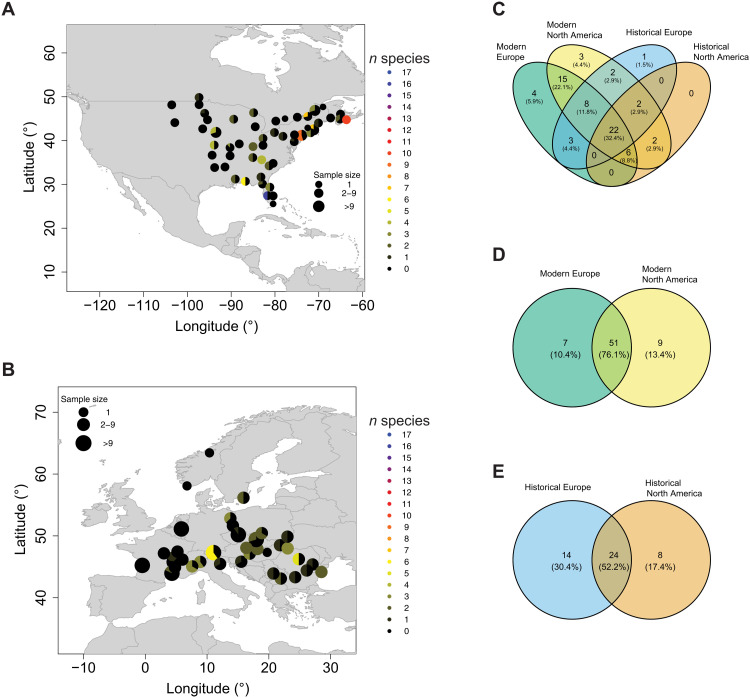
Fig. 6. Pathogen presence.
(A and B) Prevalence of Xanthomonas spp. in contemporary samples. Samples within 100 km were grouped together. The pie chart indicates the fraction of samples in which Xanthomonas spp. are present, with black indicating no Xanthomonas species identified. The color indicates how many different Xanthomonas species were identified at a location. (A) Modern North America. (B) Modern Europe. (C) Venn diagram of pathogens identified in modern European (green), modern NA (yellow), historical European (blue), and historical NA (orange) samples. (D) Venn diagram of pathogens identified in modern European (green) and modern NA (yellow) samples. (E) Venn diagram of pathogens identified in historical European (blue) and historical NA (orange) samples.

