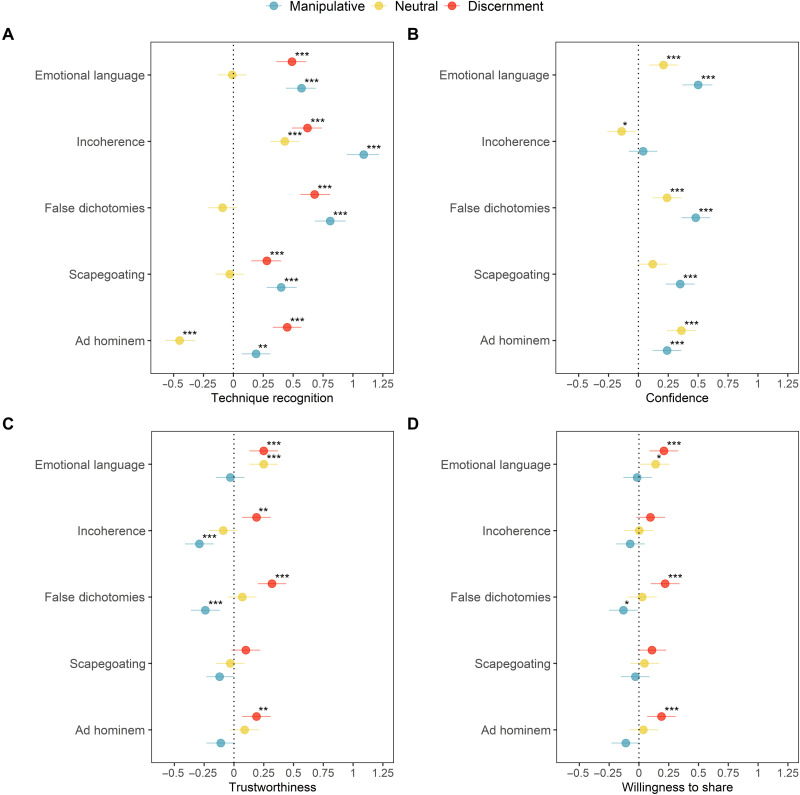
Fig. 2. Studies 1 to 5: Dot plots for effect sizes (Cohen’s d) from independent-samples t tests.
Technique recognition (A), confidence (B), trustworthiness (C), and sharing (D), by condition and study, for manipulative social media content, neutral content, and discernment (discernment indicates the difference score between manipulative and neutral content; not shown for the confidence measure). Improved discernment indicates a higher ability to distinguish manipulative from neutral stimuli. Error bars show 95% confidence intervals for Cohen’s d. ***P < 0.001, **P < 0.01, and *P < 0.05.

