Figure 3.
Concentrations and correlations of cytokines, chemokines, and growth factors in bronchoalveolar lavage samples
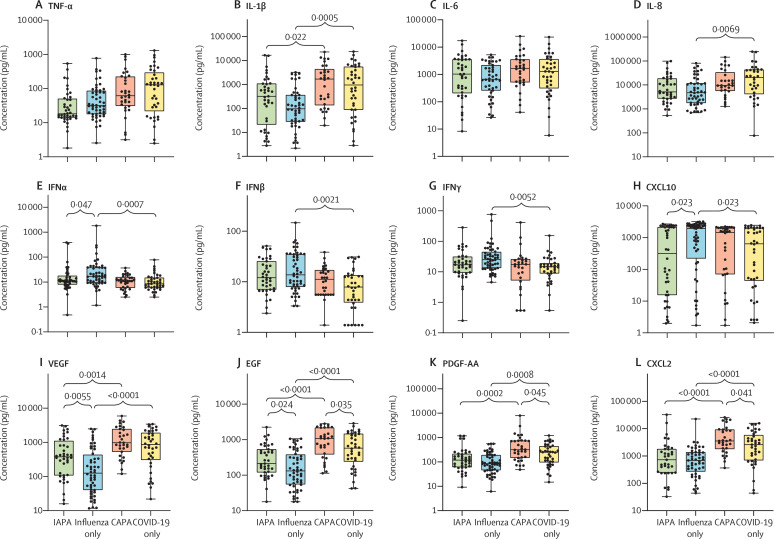
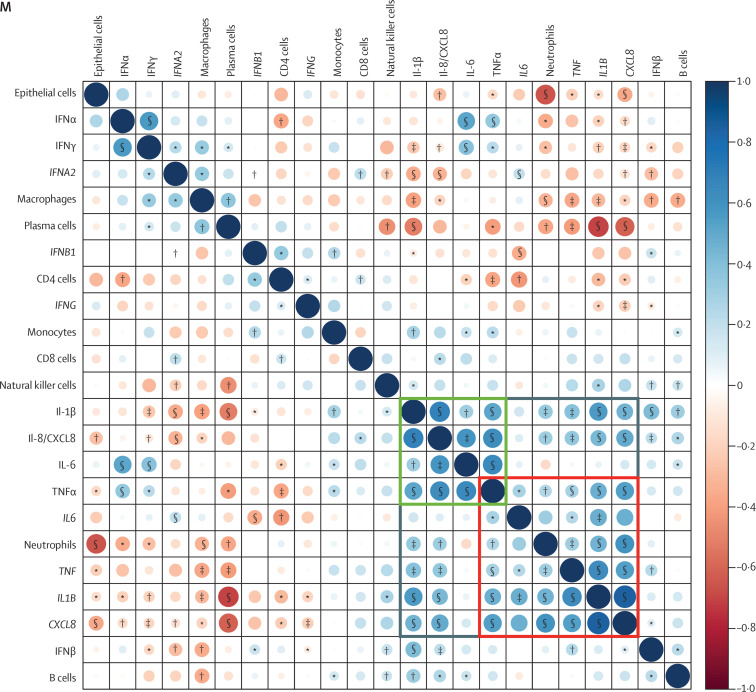
(A–L) Concentrations of major cytokines, chemokines, and growth factors. Box plots represent median and IQR, with whiskers set from minimum to maximum. Individual points represent each sample. q values were generated by Kruskall–Wallis tests, corrected by use of the Benjamini–Krieger–Yekutieli method. Only significant q values are shown. The scale between points is a log scale. (M) Correlogram showing the correlations between the CIBERSORTx-derived cell fractions, major cytokine concentrations, and gene expressions of the corresponding genes in bronchoalveolar lavage samples with all three types of results available. Components are hierarchically clustered. The grey box represents a major proinflammatory cluster. The green and red boxes represent two pro-inflammatory subclusters, with the green box representing proinflammatory cytokines and the red box representing the deconvoluted neutrophil fraction and the gene expression of proinflammatory cytokines. CAPA=COVID-19-associated pulmonary aspergillosis. EGF=epidermal growth factor. IAPA=influenza-associated pulmonary aspergillosis. PDGF-AA=platelet-derived growth factor AA. VEGF=vascular endothelial growth factor. *p<0·05. †p<0·01. ‡p<0·001. §p<0·0001.


