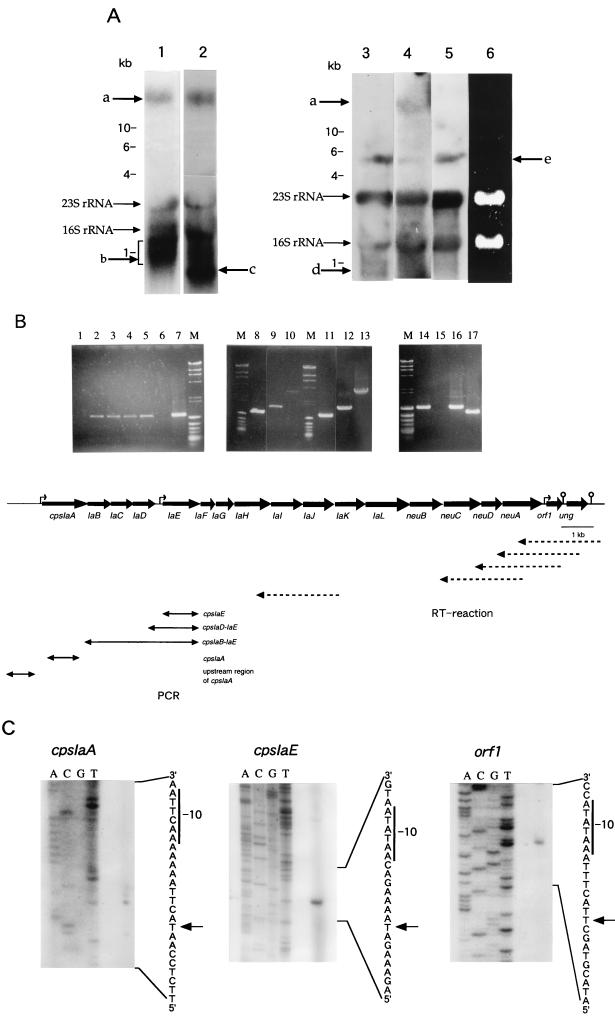
FIG. 3.
Analysis of transcription of the S. agalactiae type Ia cps gene cluster. (A) Northern blotting analysis of total RNA of S. agalactiae type Ia strain OI1. RNA was hybridized with cpsIaA (lane 1), orf1 (lane 2), cpsIaA upstream (lane 3), ung (lane 4), and ung downstream (lane 5) probes. In lane 6, total RNA was electrophoresed on a 1% agarose gel containing 2.2 M formaldehyde and detected by ethidium bromide staining. With cpsIaA, orf1 and ung probes, a long transcript which seemed to correspond to the cpsIa gene cluster was observed (band a). Such a band was not observed with cpsIaA upstream and ung downstream probes. The smeared band in lane 1 (band b) may be degradation products. Band c in lane 2 seemed to correspond to a transcript from the orf1 gene. Band d in lane 3 seemed to be produced from the upstream region of cpsIaA. Unknown bands (e) were observed with several different probes. The sizes of RNA standards (Takara) are indicated. (B) RT-PCR of cps genes. Amplification of the cpsIaE locus was performed with RT reaction products produced by using the ung 3′-downstream primer (lane 1), the ung internal primer (lane 2), the orf1 3′-end primer (lane 3), the neuA internal primer (lane 4), and the cpsIaJ 3′-downstream primer (lane 5). Amplification was also performed with a sample that was not reverse transcribed as a negative control (lane 6). cpsIaE (lane 8), cpsIaD to IaE (lane 9), cpsIaB to IaE (lane 10), cpsIaA (lane 14), and the upstream region of cpsIaA (lane 15) were amplified from the RT reaction product produced with the cpsIaJ 3′-downstream primer. These loci were also amplified by using chromosomal DNA (1 μg) of S. agalactiae type Ia as the template (lanes 7 and 11, cpsIaE; lane 12 cpsIaD to IaE; lane 13, cpsIaB to IaE; lane 16, cpsIaA; lane 17, upstream region of cpsIaA) as controls. The direction and start sites of the RT reaction are indicated by broken arrows. PCR-amplified regions are shown by solid arrows. (C) Primer extension analyses of the transcriptional initiation sites in the sequences upstream of the cpsIaA, cpsIaE, and orf1 genes. The arrows indicate the transcriptional start sites, and the −10 consensus sequences are also shown.

