. 2022 Aug 1;11:e80130. doi: 10.7554/eLife.80130

Figure 5. Force-dependent binding of cadherin/catenin complexes to F-actin.

(A) Mean binding lifetimes (red filled circles) from constant-force assay measurements from previously reported (Bax et al., 2022) wild-type E-cadherin/β-catenin/αE-catenin complex data (N = 700). These data are represented here without depicting the direction of force applied relative to the polar actin filament, and fit to a nondirectional two-state catch bond (red curve). Unfilled circles represent the mean lifetime of events collected in the low-force assay (N = 90). Envelopes indicate 95% confidence intervals for the fit, obtained by empirical bootstrapping. Areas of all circles are proportional to the number of events measured in each equal-width bin. (B) Mean binding lifetimes (blue filled circles) from pooled low- (N = 145) and constant-force assay (N = 856) measurements for ternaryΔH1 complexes. These data were fit to a one-state slip bond model (blue curve). (C) The one-state slip bond model. The conformation of a bound actin-binding domain (ABD) missing H1, denoted state B, is comparable to the strong state of the two-state catch bond model. Molecules transition between bound (B) and unbound (U) states, where the dissociation rate, kBU , increases exponentially with force.
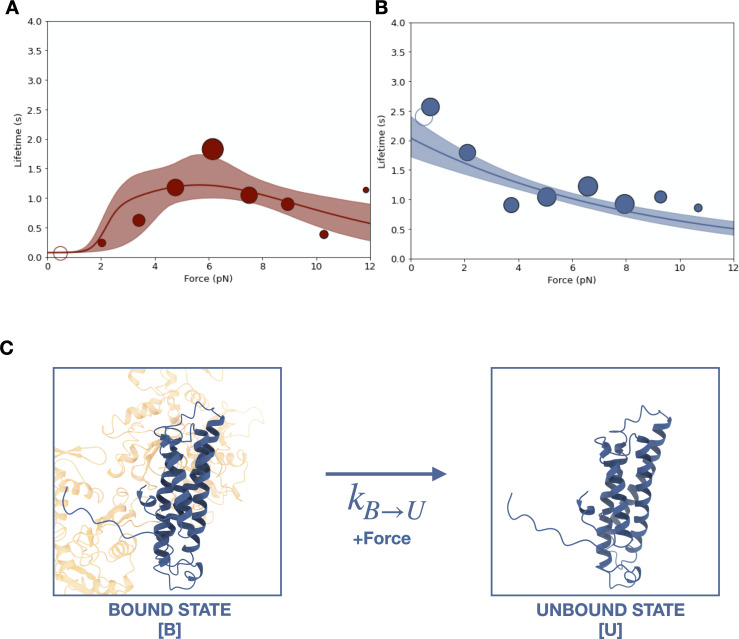
Figure 5—source code 1. Code for fitting and bootstrapping all slip bond models using maximum likelihood estimation.
Figure 5—source code 2. Code for fitting a two-state catch bond model using maximum likelihood estimation.
Figure 5—source code 3. Code for bootstrapping a two-state catch bond model using maximum likelihood estimation.

Figure 5.

Figure 5—figure supplement 1. Two-state slip bond model.

Figure 5—figure supplement 1.

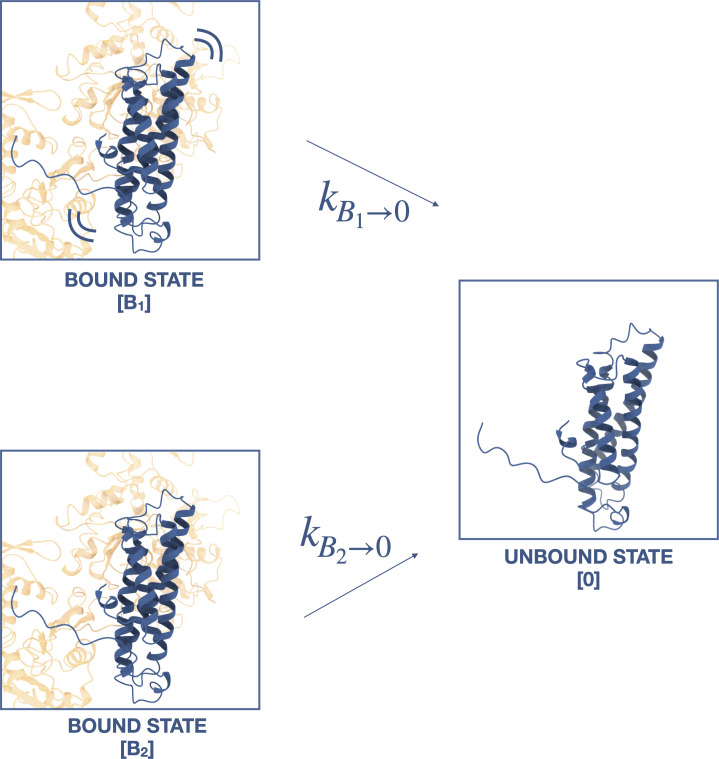
In this model, the ternaryΔH1 complex interacts with F-actin in a moderately strong bound state (B1) and strongly bound state (B2), such that that the deletion of H0 and H1 hinders the transition between B1 and B2 to impart biphasic binding lifetimes. However, Akaike information criterion (AIC) and Bayesian information criterion (BIC) suggest a single-state slip bond model better represents the data (see text).
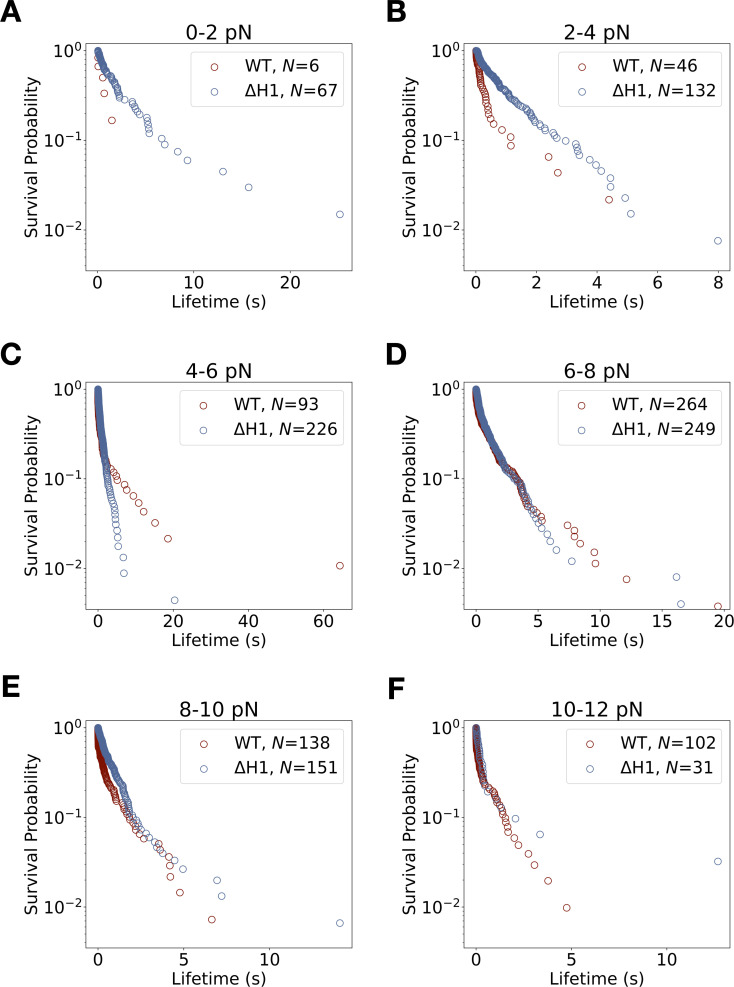
Figure 5—figure supplement 2. Lifetime survival analysis for wild-type E-cadherin/β-catenin/αE-catenin and E-cadherin/β-catenin/αE-cateninΔH1.

Figure 5—figure supplement 2.

Survival probability versus binding lifetime from constant-force measurements for each 2 pN bin width. (A) Survival lifetimes are more likely to be longer for ternaryΔH1 (blue) than wild-type ternary (red) between 0 and 2 pN. (B) The ternaryΔH1 complex survival probability distribution is qualitatively more monophasic when compared to wild-type ternary. (C) Binding lifetimes for ternaryΔH1 are more likely to be shorter than wild-type ternary complex between 4 and 6 pN. The ternaryΔH1 complex is qualitatively more monophasic than wild type. (D–F) Above 6 pN, ternary wild-type and ternaryΔH1 complex survival probability distributions at these force bins are not statistically different (p < 0.01, two-sample Kolmogorov–Smirnov [KS] test).
Figure 5—figure supplement 2—source data 1. TernaryΔH1 optical trap low-force assay multi-step data.
Figure 5—figure supplement 2—source code 1. Code for analyzing survival lifetimes across 2 pN force bins.
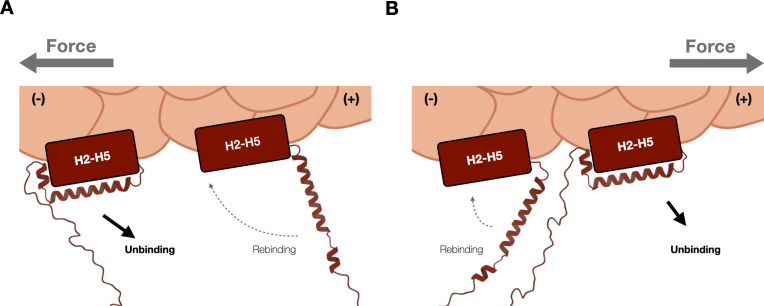
Figure 5—figure supplement 3. Molecular basis of catch bond directionality.

Figure 5—figure supplement 3.

(A) Force on actin (gray arrow) directed in the (−) direction of ternary wild type. When force is applied in the (−) direction, H1 is moved away from H2–H5 and oriented such that reassociation of H0/H1 to the H2–H5 bundle is disfavored (dotted lines). (B) Force on actin (gray arrow) directed in (+) direction of ternary wild type. When force is applied in the (+) direction, H1 is predicted to be positioned relatively closer to the H2–H5 bundle, where the bound actin-binding domain (ABD) may more likely adopt conformations similar to the five-helix weak state (dotted lines). Also see Xu et al., 2020.
Figure 5—figure supplement 3—source data 1. Data file of binding events parsed by statistically inferred directionality.
Figure 5—figure supplement 3—source code 1. Code for parsing and analyzing maximum directionality of ternary and ternaryΔH1 datasets.