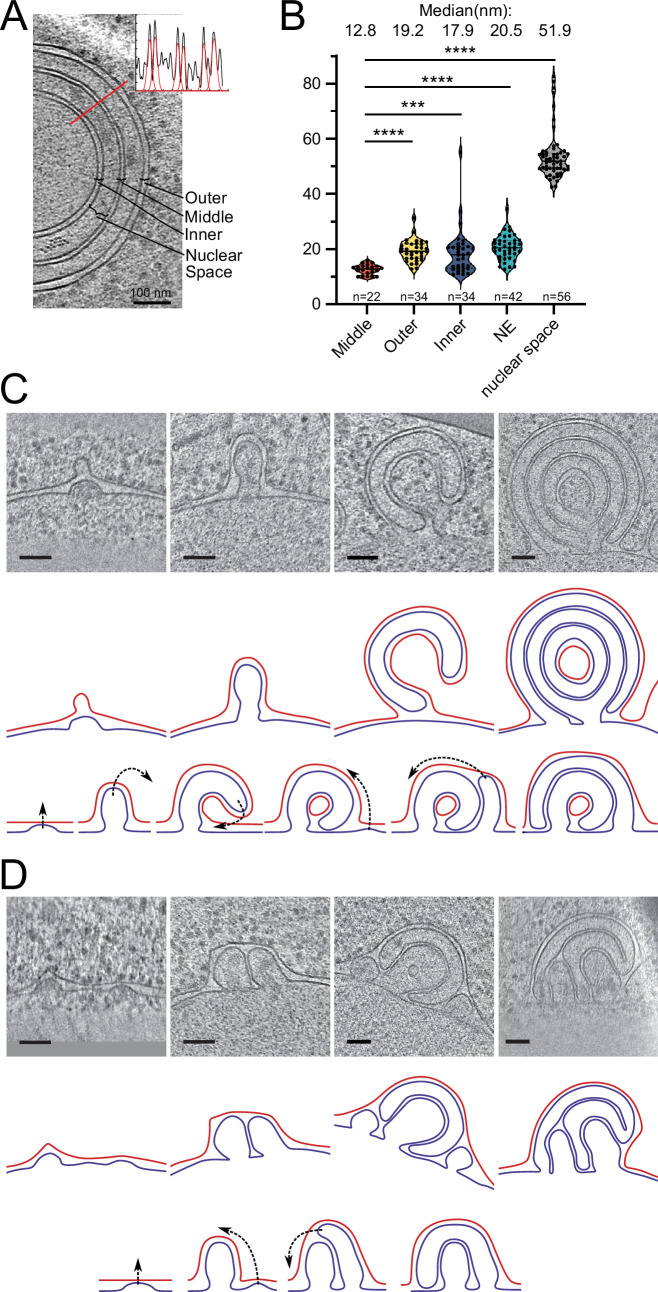
Appendix 1—figure 2. Potential maturation processes of onion-like herniations.
(A) Tomographic slice of an onion-like herniation and an example line plot with fitted Gaussians measured at the indicated red line. Brackets indicate how the distances were classified for the plot in B. (B) Violin plot with individual points of membrane–membrane distances. Mann–Whitney test, ****p-value<0.0001; ***p-value=0.0001. (C) Mode 1 for maturation of onion-like herniations. Top panel: tomographic slices of several stages of herniations in Brl1(I395D) overexpressing cells (nucleus always in the bottom); middle panel: membrane segmentation of the herniations of the upper panel. Inner nuclear membrane (INM): blue; outer nuclear membrane (ONM): red; ONM in the center of the very right panel was classified as ONM based on the presence of ribosomes and wider membrane spacing. Lower panel: schematic of how the onion-like herniations mature. (D) Same as (C) but for mode 2 of the maturation process of onion-like herniations. Scale bar: 100 nm. Slice thickness: 1.4 nm.

