. 2022 Aug 24;11:e78385. doi: 10.7554/eLife.78385

Figure 3. Brl1 degradation interferes with nuclear pore complex (NPC) assembly.

(A) Tomographic slices of focused ion beam (FIB)-milled, 4–4.5 hr auxin-treated Brl1-AID cells showing the structures quantified in (B). Image frames colored according to the color code used in (B). Scale bar 100 nm; black arrows: herniations; white arrow: NPC; N: nucleus; C: cytoplasm; slice thickness i and iii: 1.4 nm; ii and iv: 2.8 nm. Panels i and ii were cropped from tomographic slices from the tomograms in Figure 3—videos 1 and 2. (B) Quantification of 27 tomograms (8.5 µm2 NE) and 51 (16.7 µm2 NE) for -OsTIR1 and +OsTIR1, respectively. (C) Example fluorescent micrographs of yEGFP-tagged nucleoporins (NUPs) in 4–4.5 hr auxin-treated Brl1-AID ± OsTIR1 cells. (D) Normalized fluorescence intensity signal in the nuclear envelope in ±OsTIR1 Brl1-AID cells treated with 500 µM auxin for 4–4.5 hr. Mean ± SEM of a minimum of two biological replicates. (E) Recombination-induced tag exchange (RITE) method is combined with a CRE-EBD recombinase to conditionally switch fluorescence tags upon β-estradiol addition. (F) NUP RITE fusion protein localization in the Brl1-AID background 3 hr after treating cells with auxin (+auxin) or ethanol (-auxin). Recombination was induced 30 min prior to auxin addition.

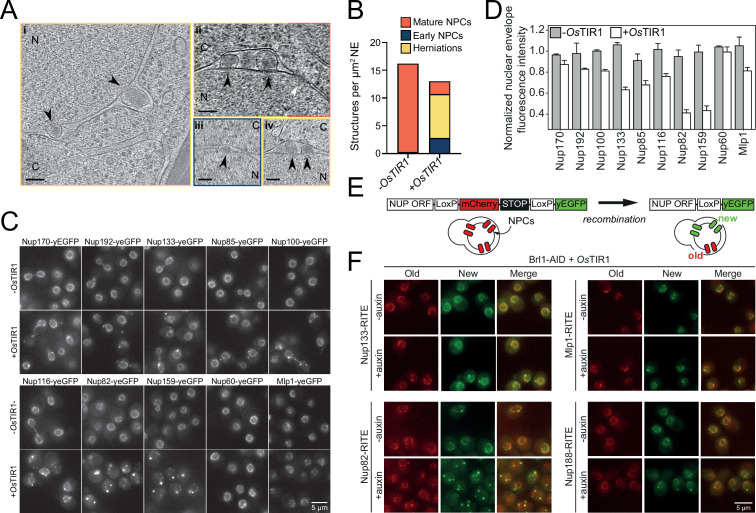
Figure 3.

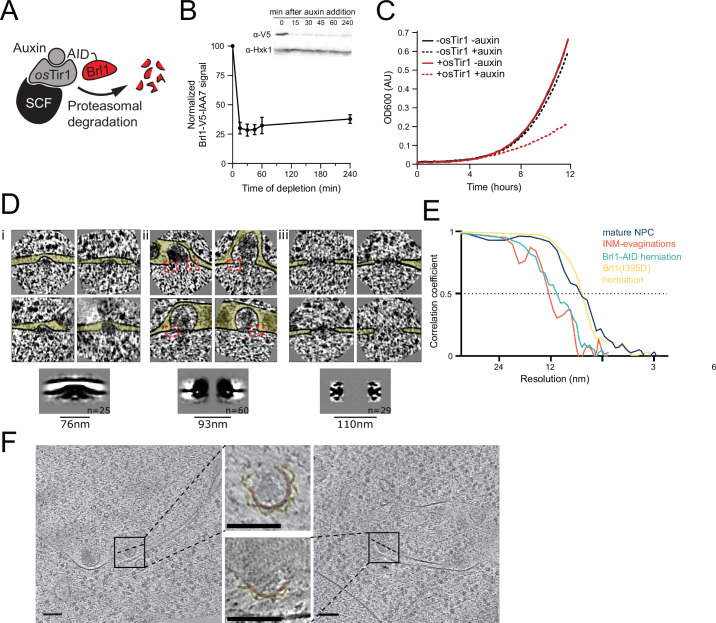
Figure 3—figure supplement 1. Characterization and subtomogram analysis of Brl1 depletion.

Figure 3—figure supplement 1.

(A) Auxin-inducible degradation of Brl1 (Nishimura et al., 2009). Interaction between degron-tagged Brl1 and the E3 ubiquitin ligase SCF is mediated by the auxin-binding receptor OsTir1. (B) Depletion of Brl1-AID monitored by Western blotting. Brl1-V5-IAA7 was detected with an anti-V5 antibody, anti-hexokinase served as loading control. Mean ± SEM of three biological replicates. (C) Growth rate of Brl1-AID±OsTir1 cells incubated with 500 µM auxin or an equivalent amount of ethanol (-auxin). (D) Subtomograms and subtomogram averages of nuclear pore complexes (NPCs) and NPC-like structures in Brl1-depleted conditions; (i) inner nuclear membrane (INM) evaginations, (ii) nuclear envelope (NE) herniations, and (iii) mature NPCs. Diameter and number of particles are indicated. Cytoplasm is pointing up in all images. Box size of single herniations/NPCs is 270 nm. Red boxes indicate NPC-like densities at the neck of herniations. (E) Fourier shell correlation (FSC) curves for the subtomogram averages in D and Figure 7. FSC0.5 indicated as dotted line. (F) Tomographic slices of focused ion beam (FIB)-milled 4–4.5 hr auxin-treated Brl1-AID cells; slices through herniations show a luminal ring around the herniation, highlighted in yellow, NPC membrane in red; the rotation axis is indicated by a dashed line; scale bars: 100 nm; slice thickness: 1.4 nm.
Figure 3—figure supplement 1—source data 1. Uncropped Western blots (related to Figure 3—figure supplement 1B, Figure 5E and F).
Figure 3—video 1. Sequential sections of a cryo-tomogram from Brl1-depleted cells.
Download video file (29.5MB, mp4)
The tomogram is 6× binned; pixel size: 2.1 nm; scale bar: 100 nm.
Figure 3—video 2. Sequential sections of a cryo-tomogram from Brl1- depleted cells.
Download video file (24.8MB, mp4)
The tomogram is 6x binned; pixelsize: 2.1nm; scalebar: 100nm.
Figure 3—video 3. Sequential sections of a cryo-tomogram from non-depleted Brl1 control cells.
Download video file (12.2MB, mp4)
The tomogram is 6× binned; pixel size: 2.1 nm; scale bar: 100 nm.
Figure 3—video 4. Sequential sections of a cryo-tomogram from non-depleted Brl1 control cells.
Download video file (22.6MB, mp4)
The tomogram is 6x binned; pixelsize: 2.1nm; scalebar: 100nm.