. 2022 Aug 24;11:e78385. doi: 10.7554/eLife.78385

Figure 6. Overexpression of Brl1(I395D) with an impaired amphipathic helix interferes with nuclear pore complex (NPC) assembly.

(A) Spotting assay of wildtype cells expressing Brl1, Brl1Δah, or Brl1(I395D) from the GAL1 promoter in glucose or galactose-containing medium. (B) Localization of yEGFP-tagged Brl1, Brl1Δah, or Brl1(I395D) from the GAL1 promoter in SD 2% galactose. Brightness contrast settings of nuclei in insets are adjusted differently. (C) Fluorescence recovery after photobleaching of Sec61-yEGFP, Brl1-mCherry and Brl1(I395D)-mCherry. Left panels: representative images of recovery; right: corresponding averaged recovery curves (n > 4). One representative experiment of three biological replicates is shown. Images are shown in pseudocolor. (D) Co-localization of mCherry-tagged Brl1 or Brl1(I395D) and yEGFP-tagged NUPs: mCherry channel is scaled differently between images. Maximum intensity plots of nucleoporins (NUPs) (green lines) relative to maximum Brl1(I395D)-mCherry signal in nuclear envelope (NE) foci (red line) from cytoplasm (bottom) to nucleoplasm (top). The arrows in the inset and the x-axis indicate the direction of measurement. Average and standard deviation of more than 38 line plots with n > 31 values averaged for each point. A representative image used for the analysis is shown for each condition in the inset.

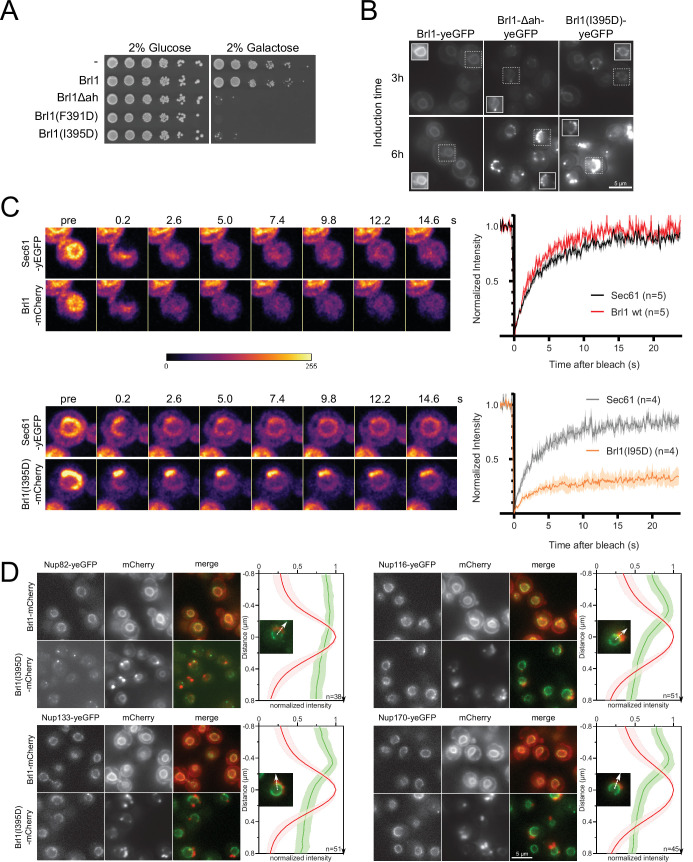
Figure 6—source code 1. Fluorescence recovery after photobleaching (FRAP) analysis.
Figure 6—source data 1. Line plots.

Figure 6.

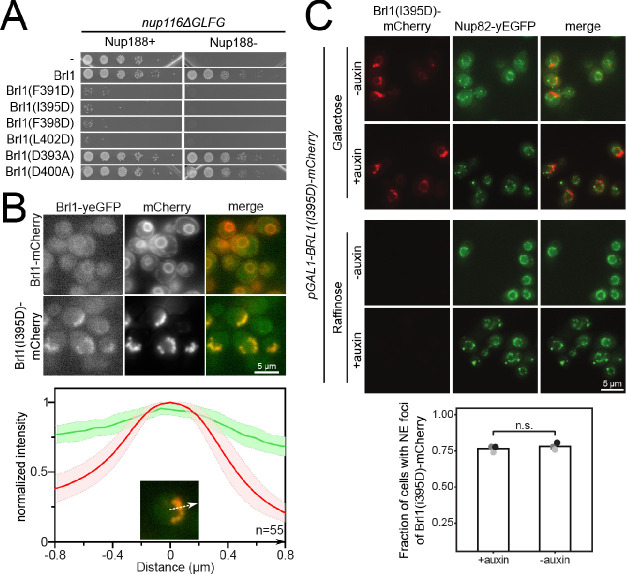
Figure 6—figure supplement 1. Luminal amphipathic helix (AH) of Brl1 is involved in nuclear pore complex (NPC) biogenesis.

Figure 6—figure supplement 1.

(A) Spotting assay of fivefold serial dilutions of nup116ΔGLFG PMET3-NUP188 cells expressing various ahBrl1 domain mutants from the GAL1 promoter. (B) Co-localization of mCherry-tagged Brl1 or Brl1(I395D) expressed from a galactose-inducible promoter with endogenously tagged Brl1-yEGFP. Lower panel: maximum intensity plots of Brl1 (green line) relative to maximum Brl1(I395D)-mCherry signal in nuclear envelope (NE) foci (red line) from nucleoplasm (left) to cytoplasm (right). Average and standard deviation for 55 line plots, every point is an average of n > 30 values. A representative image used for analysis is shown in the inset. The arrows in the inset and the x-axis indicate the direction of measurement. (C) Brl1(I395D)-mCherry under the control of a galactose promoter was overexpressed by switching cells to a medium containing 2% galactose simultaneously with the auxin-induced degradation of endogenous Brl1 (+auxin) or the treatment with ethanol (-auxin). Cells were imaged 6 hr after induction. Lower panel: quantification of the fraction of cells with at least one NE focus of Brl1(I395D) in cells overexpressing Brl1(I395D)-mCherry. Three biological replicates (points) with a minimum of 637 cells per replicate and their mean (bar) are shown. Two-tailed Student’s t-test (n = 3, p-value = n.s.).