Figure 1.
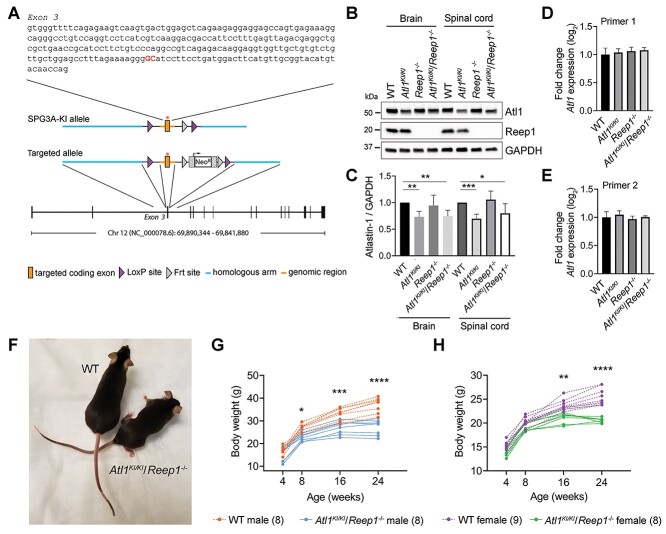
Generation and characterization of Atl1KI/KI/Reep1−/− mice. (A) Schematic representation of Atl1 gene targeting strategy. (B) Immunoblots of tissue homogenates show atlastin-1 and Reep1 protein levels in brain and spinal cord from WT mice and the indicated mutant genotypes. GAPDH is monitored as a control for protein loading. (C) Quantitative analyses of immunoblot results reveal that mutated atlastin-1 K80A levels are slightly lower than WT, with normalization to GAPDH. Student’s t tests were applied; n = 4. (D, E) qPCR results show no differences in mRNA levels between Atl1 and Atl1KI/KI using two sets of Atl1 primers. (F) Photo comparison of 6-month-old WT and Atl1KI/KI/Reep1−/− female mice. (G, H) Double mutant mice show lower body weights starting at 8 weeks in males (G) and 16 weeks in females (H). Parentheses at the bottom indicate numbers of mice in each group. Two-way ANOVA (Tukey’s test) was applied. *P < 0.05, **P < 0.01, ***P < 0.005, ****P < 0.001.

