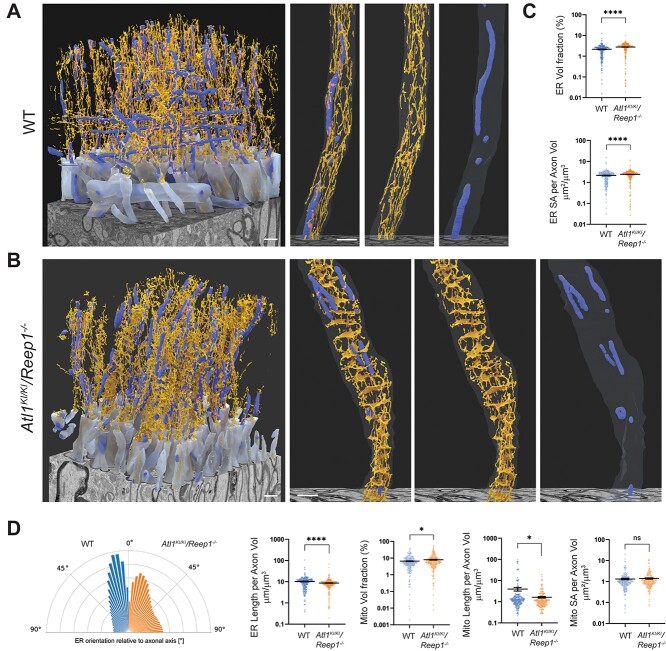
Figure 5.
Machine-learning-based reconstructions and analyses of ER and mitochondria in corticospinal axons. (A, B) Orthographically projected 3D renderings of WT (A) and Atl1KI/KI/Reep1−/− (B) myelinated axons (translucent light blue), mitochondria (darker blue) and ER (orange) are shown alongside the FIB-SEM datasets. A representative axon is shown in the right three panels (merged image, ER and mitochondria from left to right). (C) ER volume (top) and surface area (SA; bottom) are quantified as a fraction of axon volume for each axon within the FIB-SEM volume. (D) Quantifications are shown for: orientation of ER relative to local axon orientation; ER length; mitochondrial volume; mitochondrial length and mitochondrial surface area. All measurements are normalized on a per axon basis to axonal volume. Mann–Whitney test was applied for statistical analyses. n = 265 (WT axons) and 268 (Atl1KI/KI/Reep1−/− axons). *P < 0.05, ****P < 0.001, ns—not significant. Scale bars 1 μm.

