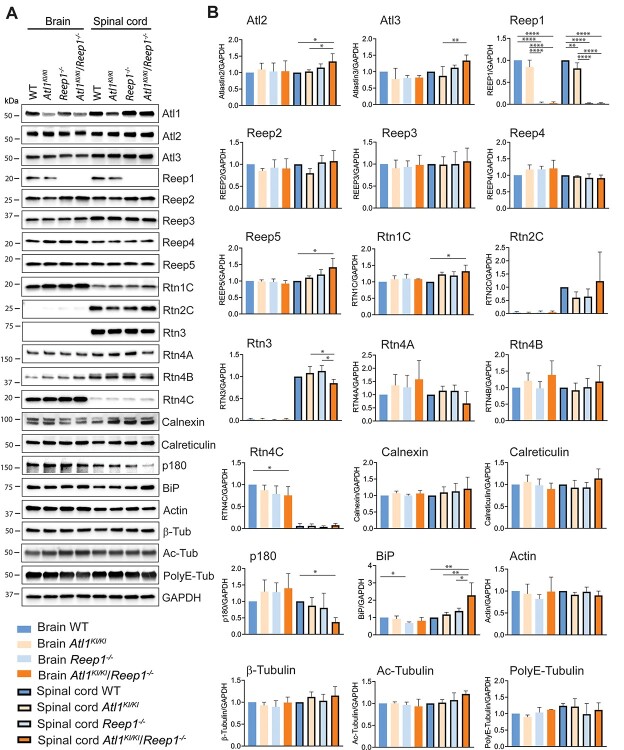
Figure 6.
ER protein levels in Atl1KI/KI/Reep1−/− CNS. (A, B) Lysates of brain and spinal cord from 6-month-old mice (WT and the indicated mutant genotypes) were immunoblotted as shown in A, with quantifications in B. One-way ANOVA (Tukey’s test) was applied for statistical analyses. n = 4. *P < 0.05, **P < 0.01, ****P < 0.001.

