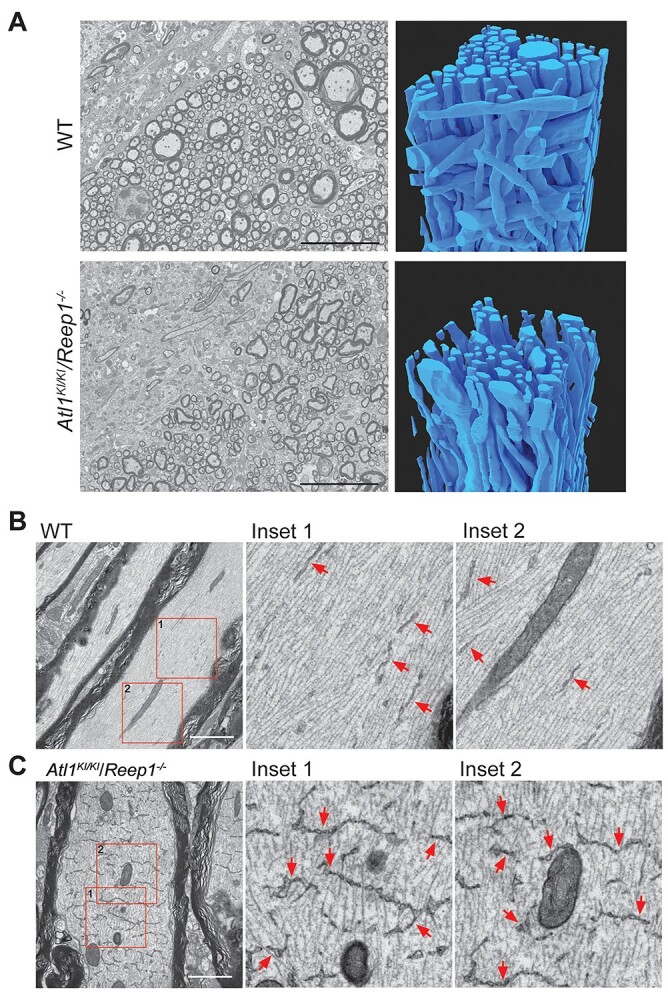
Figure 3.

Transmission EM and FIB-SEM images of lumber spinal cord. (A) Transmission EM (left) and FIB-SEM reconstructions (right) of dorsal corticospinal tract area of 6-month-old mice showing degeneration in Atl1KI/KI/Reep1−/− axons relative to WT. Scale bars 10 μm. (B, C) Transmission EM images show dramatically expanded transverse ER in myelinated axons in Atl1KI/KI/Reep1−/− mice (C) as compared with WT mice (B). Boxed areas at the far left are enlarged to the right. Arrows (red) indicate ER. Scale bars 2 μm.
