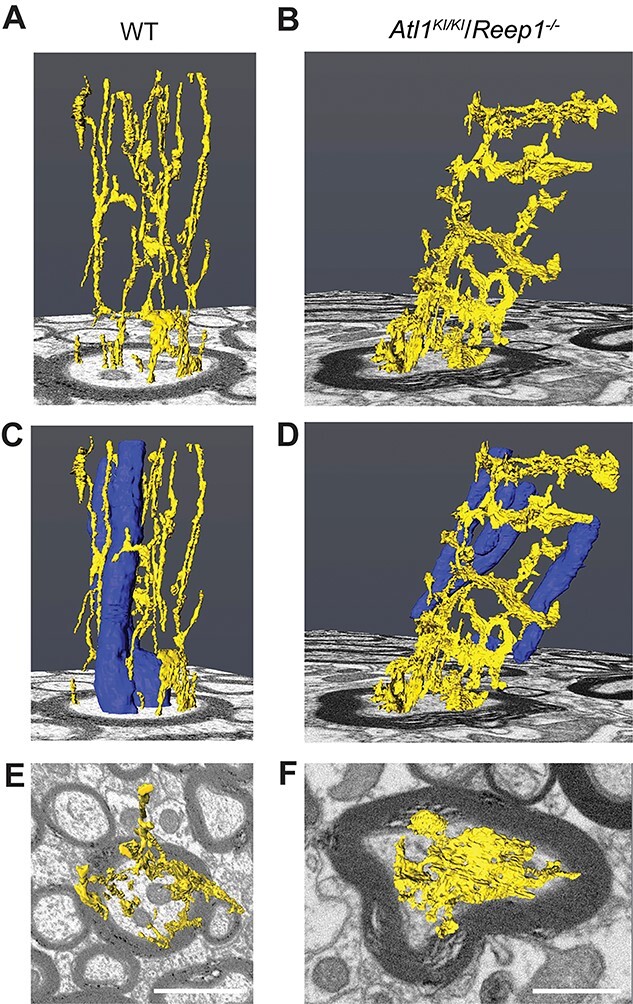
Figure 4.

Manual 3D axonal reconstructions of FIB-SEM images. (A–F) ER is shown in yellow and mitochondria in blue. A, C and F show a randomly selected corticospinal axon from a WT mouse, whereas B, D and F show an axon from a Atl1KI/KI/Reep1−/− mouse. E and F are views looking down from the top of A and B, respectively. Scale bar 1 mM.
