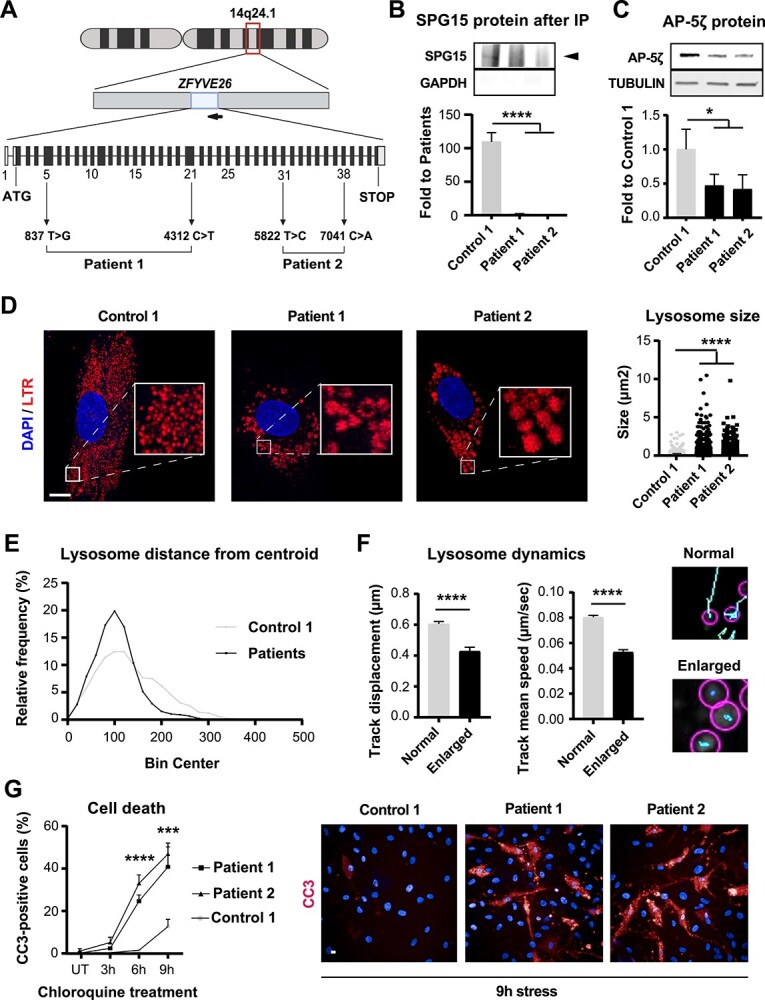
Figure 1.

Hallmarks of SPG15 pathology in fibroblasts. (A) Schematic of the ZFYVE26 locus. The gene, consisting of 42 exons (solid boxes), is located on chromosome 14q24.1 and encoded in the reverse DNA strand (arrow pointing left). Mutations affecting the HSP15 patients included in this study are highlighted. (B) The SPG15 protein is absent in patient cells. Immunoblotting for SPG15 following immunoprecipitation of endogenous SPG15 protein confirms the presence of an SPG15-specific band only in Control cells (black arrowhead). N = 4, Unpaired t-test. Error bars represent SD. **** corresponds to P < 0.0001. (C) Immunoblotting shows a significant reduction in AP-5ζ in patients compared to controls. N = 3. Unpaired t-test, error bars represent SD. * corresponds to P < 0.05. (D) LTR-positive organelles of SPG15 patients are aberrantly enlarged. Confocal micrographs show the endo-lysosomal compartment labeled with Lysotracker Red DND-99 (LTR). Boxed regions are zoomed-in in the insets (left). As confirmed with image quantification (right), patient lysosomes are significantly larger than normal. Scale bar = 10 μm. N = 3 (independent experiments, each evaluating at least 100 lysosomes). Mann–Whitney test. **** corresponds to P < 0.0001. (E) Enlarged lysosomes are located perinuclearly. Quantification of the relative percentage of lysosomes exhibiting varying distances from the cell’s centroid expressed as ‘bin centers’. (F) Enlarged lysosomes exhibit impaired dynamics. Quantification of lysosomal track displacement and mean speed from live-cell imaging reveals a significant reduction in the motility of enlarged lysosomes (left). Snapshots from videos showing segmented lysosomes and tracks produced over time provide a visual clue (right). Micrographs display detected lysosomes (pink circles) and their respective tracks (light blue lines). N = 3 (independent experiments, each evaluating at least 100 lysosomes). Mann–Whitney test, error bars represent SEM. **** corresponds to P < 0.0001. (G) SPG15 cells are more vulnerable. A time-course of fibroblast susceptibility to apoptotic cell death over chloroquine treatment for 3, 6 and 9 h shows that patient cells exhibit significantly higher apoptotic rates at 6 and 9 h post-treatment (left) as illustrated by confocal micrographs of cells stained with CC3 (right). N = 3 (independent experiments, each evaluating at least 500 cells). Scale bar = 10 μm. Mann–Whitney test, error bars represent SEM. *** and **** correspond to P < 0.001 and P < 0.0001, respectively.
