Figure 3.
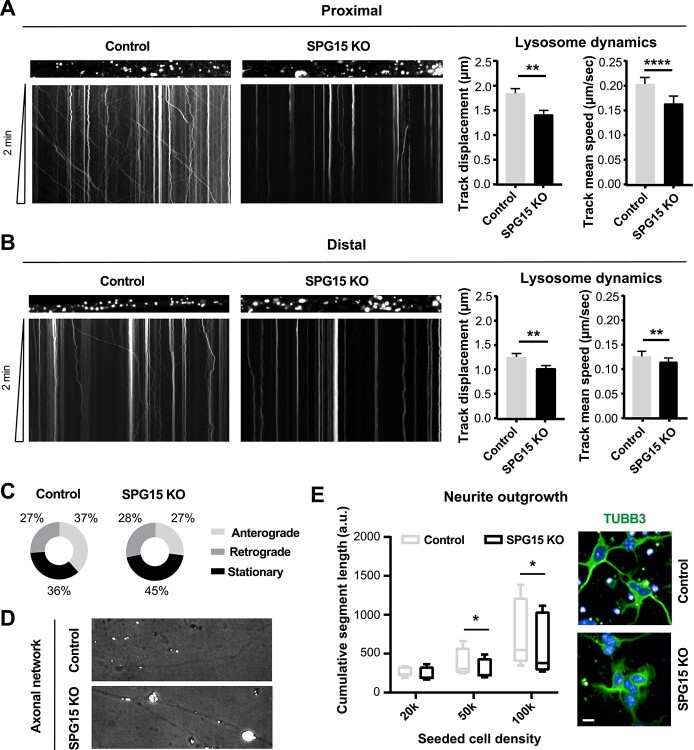
SPG15 KO neurons exhibit impaired axonal trafficking. Kymographs displaying lysosomal dynamics along (A) proximal and (B) distal axons of primary cortical neurons cultured in microfluidic chambers reveal significantly altered lysosomal shuttling in SPG15 KO cells (left), as quantified in the bar graphs (right). N = 3 (independent experiments, each assessing at least 10 positions). Error bars represent SEM. t-test. ** and **** correspond to P < 0.01 and P < 0.0001, respectively. (C) Pie charts showing the directionality of lysosomal shuttling in proximal axons. SPG15 KO neurons display an increase in the stationary fraction concomitant to a reduction in the lysosomal pool moving anterogradely. (D) SPG15 KO neurons show axonal swellings enriched in stalling lysosomes. Micrographs are brightfield images (highlighting the axonal network) overlayed with Lysotracker Red DND-99 fluorescent signal (labeling lysosomes). (E) Neurite outgrowth is hampered in SPG15 KO primary cortical neurons. The plot depicts cumulative neurite length per genotype at increasing cell densities. Example confocal micrographs show that the neurites of control neurons, stained with Tubulin Beta 3 (TUBB3), sprout more promptly. N = 3 (independent experiments, each evaluating at least 300 cells). Scale bar = 10 μm. t-test, error bars represent SEM. * corresponds to P < 0.05.

