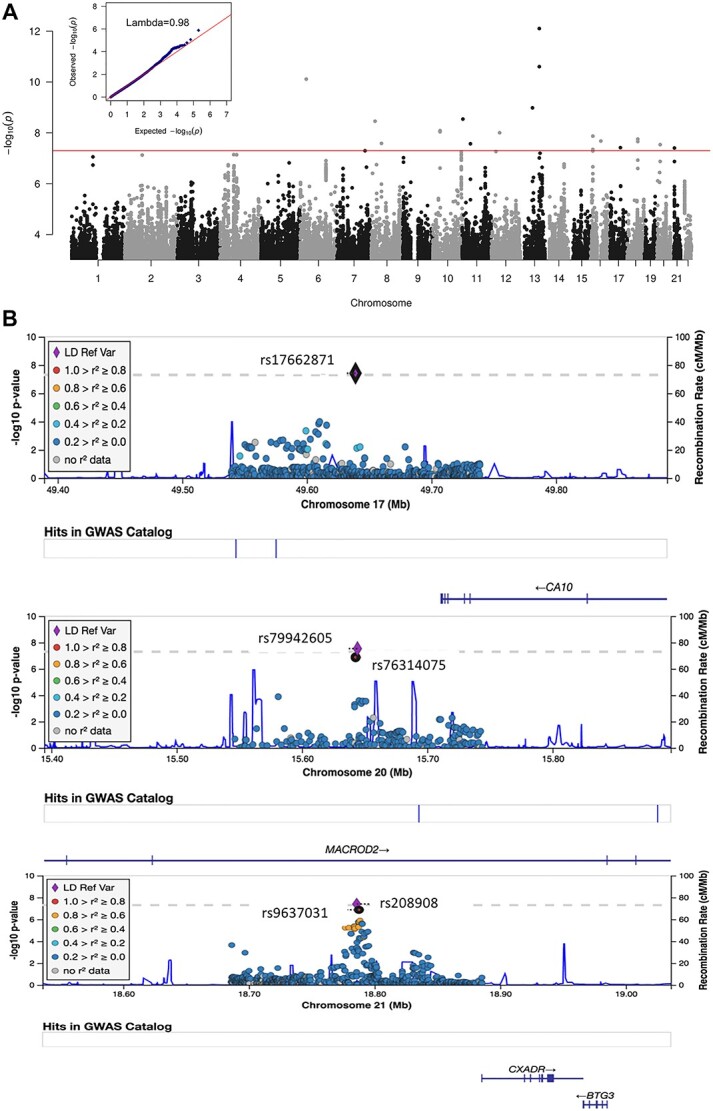
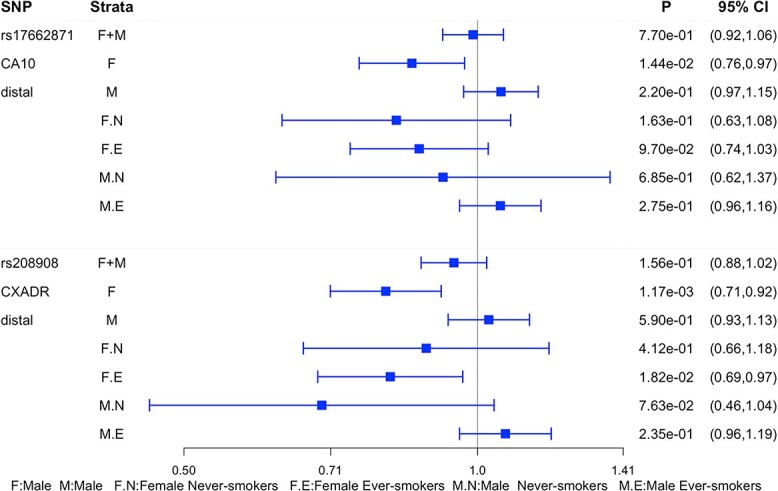
Figure 2.


Plot of signals from genome-wide gene–sex interaction analysis in lung cancer. (a) Manhattan plot of P-values from case-only meta-analysis. No inflated type I error was detected in the analysis (lambda = 0.98). (b) Regional plot at three significant regions. (c) Forest plot of stratified lung cancer risk for the most significant SNP from each region.
