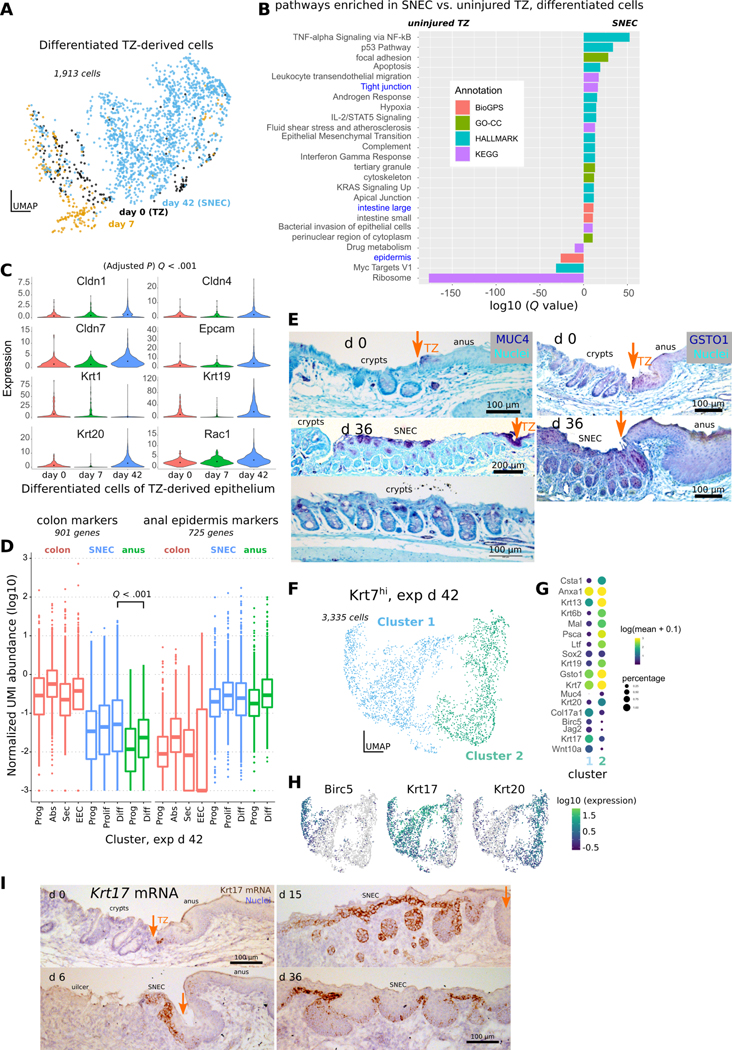
Figure 6: SNEC upregulates colonic expression patterns.
A) UMAP of differentiated (suprabasal, Col17a1lo) Krt7hi cells coded by experimental day. Datapoints representing SNEC cells at exp d 42 appear to be displaced from datapoints of TZ-derived cells at exp d 0 and exp d 6. B) Comparison of enriched genes at exp d 42 include those associated with tight junction pathways and colonic tissue. Annotations are obtained using enrichr. C) Violin plots of significant increases in junctional and colonic genes at exp d 42; significance was evaluated in monocle3. D) Boxplot similar to that shown in Fig. 3I comparing expression of colonic and anal marker expression at exp d 42. Like uninjured TZ, SNEC has elevated expression of colonic markers compared to anal epidermis. E) Immunostaining for MUC4 shows presence of colon-like “differentiated” cells in SNEC in the suprabasal layer at exp d 36. MUC4+ cells were also found in the uninjured TZ. GSTO1-targeted antibody labels TZ and SNEC suprabasal cells, but not crypt cells. Orange arrows mark the dentate line. F) UMAP of TZ-derived cells at exp d 42 shows 2 distinct clusters. G) The dotted plot indicates a proliferative (Birc5hi) basal (Col17a1hi) cluster (cluster 1) and a nonproliferative suprabasal cluster enriched for Krt19, Krt20, and Muc4. H) Expression of proliferative markers (Birc5) and specific keratins (Krt17, Krt20) in different cells at exp d 42. I) In situ hybridization reveals that Krt17 mRNA expression specifically marks a subset of basal cells of the uninjured TZ and of SNEC. See also Figure S10, S11.

