Figure 1.

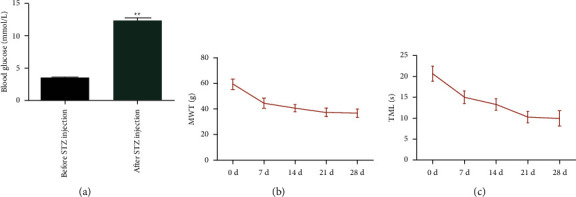
Construction of the rat DPN model: (a) the blood glucose in rats before and after STZ injection. ∗∗P < 0.01vs. blood glucose before STZ injection; (b) MWT in rats after STZ injection at 0, 7, 14, 21, and 28 days; (c) TML in rats after STZ injection at 0, 7, 14, 21, and 28 days.
