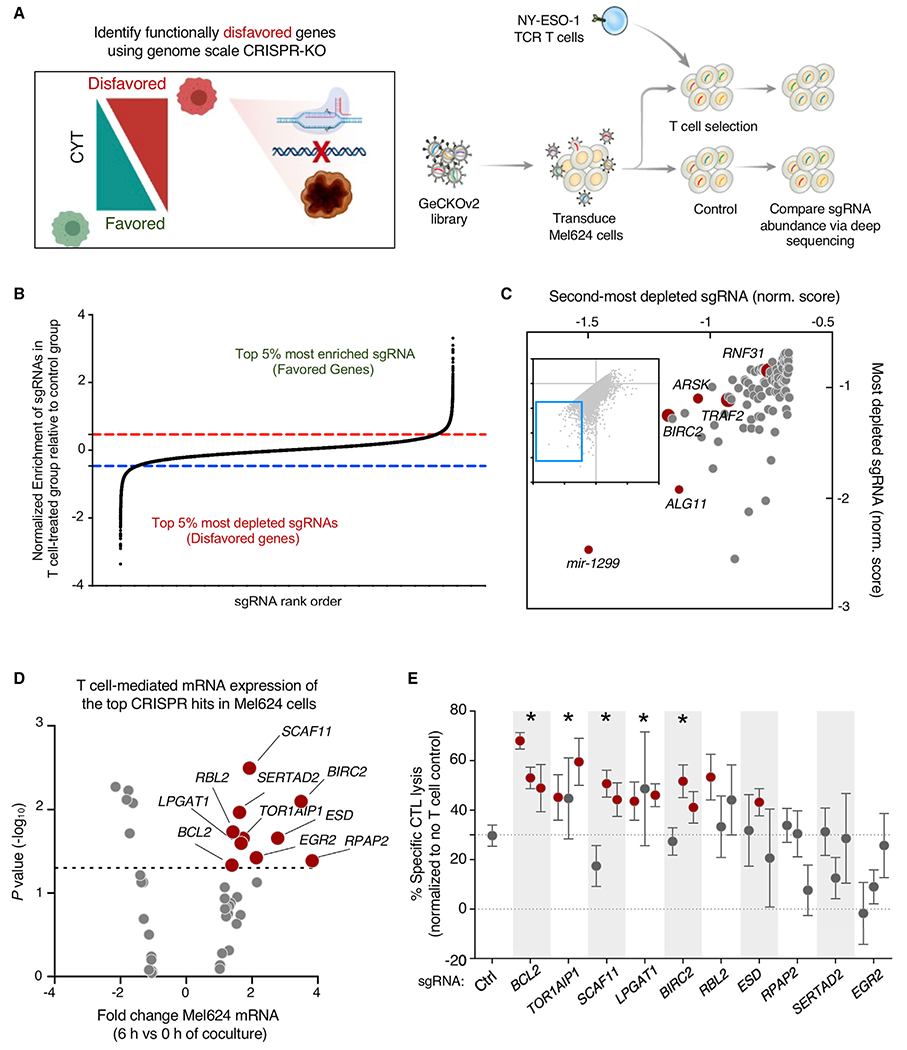
Figure 3. Genome-scale 2CT assay uncovers tumor genes disfavoring T cell CYT.

(A) Comprehensive functional genomics analysis of the potential for individual tumor genes to disfavor tumor killing by T cells. Mel624 melanoma cells were transduced with the Genome-scale CRISPR Knockout (GeCKOv2) library and cultured with ESO T cells for 6 h. sgRNA representation was measured in control and ESO T cell-treated tumor cells. Enrichment and depletion of sgRNA representation in ESO T cell-treated tumor cells was compared with control treated cells.
(B) Representation of sgRNA abundance in T cell-treated tumor cells relative to control tumor cells. The top 5% most depleted sgRNAs (targeting tumor genes whose expression disfavors T cell killing of tumor) and top 5% most enriched sgRNAs (targeting tumor genes whose expression favors T cell killing of tumor) are indicated.
(C) Scatterplot of the normalized enrichment of the most-depleted sgRNA versus the second-most depleted sgRNA for all genes after ESO T cell treatment (top 100 most depleted genes depicted in enlarged region.
(D) Volcano plot representing differentially expressed tumor genes (identified in Figure 1H) that were identified as being significantly depleted from duplicated CRISPR 2CT screens by RIGER analysis (n = 42 genes). Expression of genes was analyzed by RNA-seq, with abundance represented as relative fold change (x axis) versus significance (y axis). Ten genes that met CRISPR screen depletion criteria were significantly induced by T cell engagement (red dots; p < 0.05, fold change >1.3.
(E) The effect of gene knockout on tumor susceptibility to killing by T cells was measured by flow cytometry. Tumor genes identified in (D) were targeted with 3 independent sgRNAs. A375 melanoma cells were transduced with each sgRNA and Cas9, co-cultured with ESO T cells, and tumor killing assayed. Statistically significant sgRNAs for individual genes are indicated by red dots, as they resulted in a significant increase in tumor killing by T cells relative to non-targeting sgRNA (p < 0.05, Student’s 2-tailed t test). A gene was considered validated (indicated with *) if ≥2 sgRNAs targeting that gene resulted in statistically significant increases in T cell killing. Error bars depict standard deviation.
Data are representative of 2 independent experiments, with 4 technical replicates per experiment.
