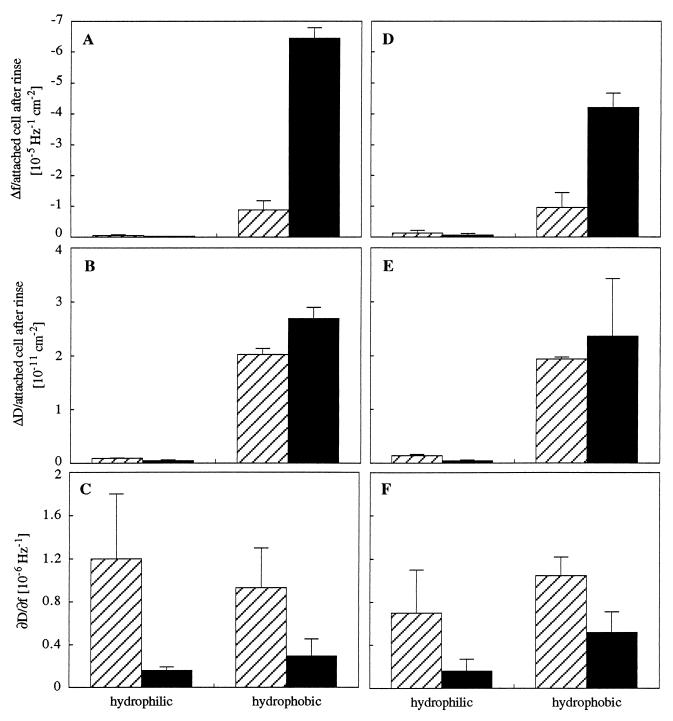
FIG. 6.
Subsequent interactions of attached cells with hydrophilic and hydrophobic surfaces upon rinse during 60 min of adhesion. Frequency shifts (Δf) per attached cell after a rinse at an ionic strength of 0.1225 M (A) and 0.31 M (D) and dissipation shifts (ΔD) per attached cell after a rinse at 0.1225 M (B) and 0.31 M (E). Also shown is the ∂D/∂f for adhesion at an ionic strength of 0.1225 M (C) and 0.31 M (F). Hatched bars represent the results for E. coli MS7fim−, and black bars represent the results for strain MS7fim+. Data presented are means ± standard deviations (error bars) from two to four experiments.

