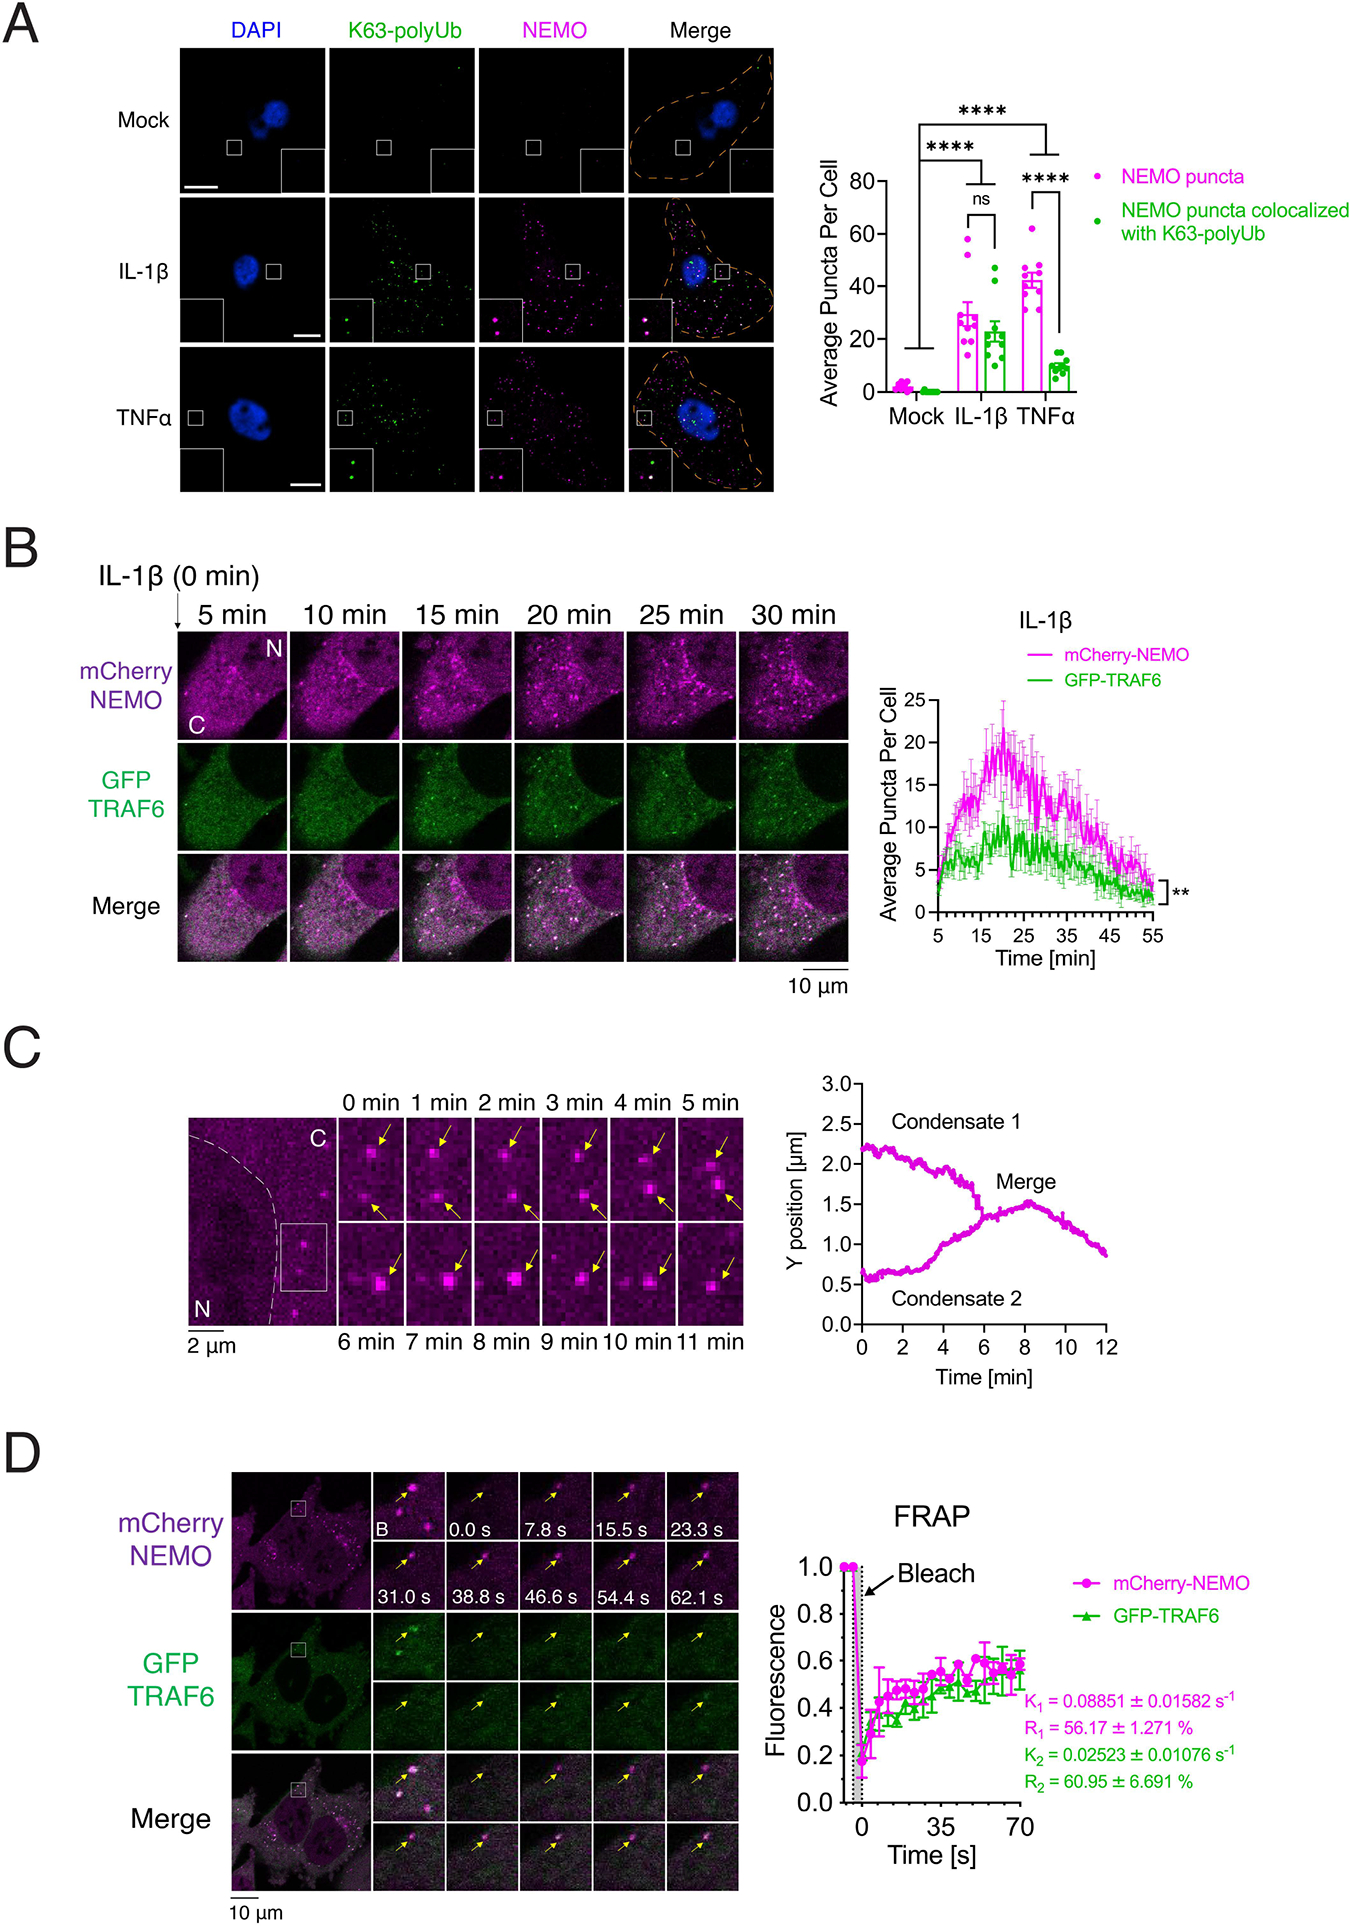
Figure 3. NEMO forms liquid-like condensates in cells in response to stimulation.

(A) Left panel: Immunofluorescence staining of K63-linked polyubiquitin chains in U2OSmCherry-NEMO Knock-in cells stimulated with either IL-1β or TNFα. Scale bars, 10 μm. Right panel: quantification of average numbers of NEMO puncta and those containing both NEMO and K63-polyUb per cell. Shown are means ± SEM. n = 10 cells. Two-way analysis of variance (ANOVA). n.s., P > 0.0332; ****P < 0.0001.
(B) Left panel: representative live cell images of NEMO condensates in HCT116NEMO KO-mCherry-NEMO/GFP-TRAF6 cells stimulated with IL-1β. N: nucleus; C: cytoplasm. Right panel: quantification of average numbers of condensates containing NEMO or TRAF6 per cell over the time course. Shown are means ± SEM. n = 4 cells. **P < 0.0021, one-way analysis of variance (ANOVA).
(C) Left panel: time-lapse micrographs of NEMO condensate formation and fusion (time 0 represents 20 min after adding IL-1β). Arrows indicate condensates. The fusion events existed in all three fields examined. N: nucleus; C: cytoplasm. Right panel: tracking the movement and fusion (y position vs time) of two NEMO condensates.
(D) Left panel: representative micrographs of NEMO condensates before and after photobleaching (arrow, bleach site). NEMO condensates formed in HCT116NEMO KO-mCherry-NEMO/GFP-TRAF6 cells stimulated by IL-1β. Right panel: quantification of FRAP of NEMO puncta over a 70-s time course. K, exponential constant; R, normalized plateau after fluorescence recovery. Shown are means ± SD. n = 3 NEMO condensates.
