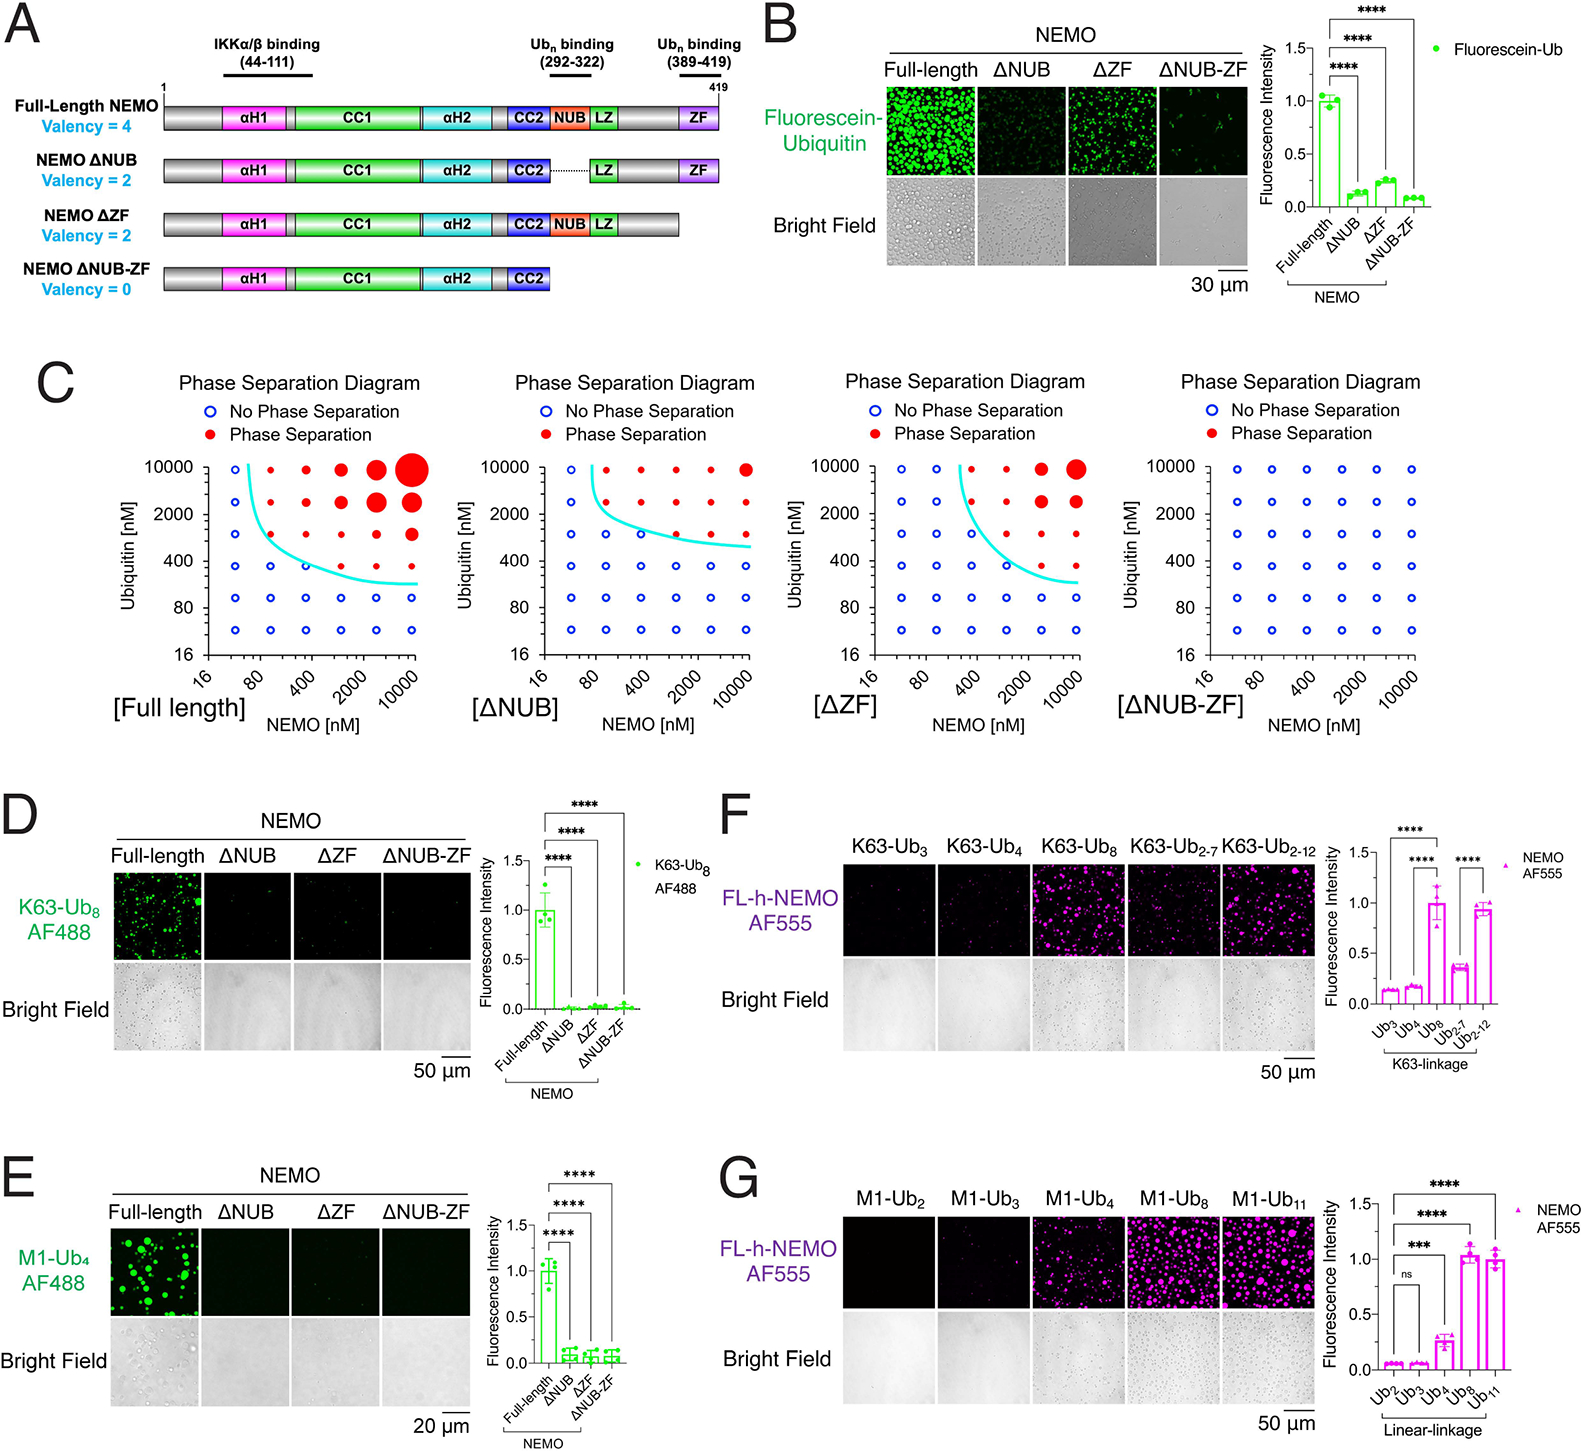
Figure 5. Multivalent interactions between NEMO and polyUb drive their liquid phase separation.

(A) Schematic of valencies of ubiquitin binding by NEMO and its ubiquitin-binding mutants.
(B) Left panel: representative images of phase separation by mixing full-length NEMO or its mutants (ΔNUB, ΔZF and ΔNUB-ZF) with K63-polyUb chains synthesized in a reaction mixture containing E1, UBC13/UEV1A, TRAF6, ubiquitin and fluorescein ubiquitin. Right panel: quantification of fluorescence intensity of liquid droplets. Shown are means ± SD. n = 3 areas.
(C) Phase separation diagrams of varying concentrations of NEMO or its mutants incubated with K63-polyUb chains synthesized in a reaction mixture containing varying concentrations of ubiquitin. Blue empty circles: no liquid droplets formed; Red solid circles: liquid droplets formed, and the circle sizes illustrate the sizes of liquid droplets. Representative images of the liquid droplets are shown in Figure S12B.
(D) Left panel: representative images of phase separation by mixing K63-Ub8 with NEMO or its mutants as indicated. Right panel: quantification of fluorescence intensity of liquid droplets. Shown are means ± SD. n = 4 areas.
(E) Left panel: representative images of phase separation by mixing M1-Ub4 with NEMO or its mutants as indicated. Right panel: quantification of fluorescence intensity of liquid droplets. Shown are means ± SD. n = 4 areas.
(F) Left panel: representative images of phase separation by mixing full-length human NEMO with K63-polyUb of different lengths as indicated. Right panel: quantification of fluorescence intensity of liquid droplets. Shown are means ± SD. n = 4 areas.
(G) Left panel: representative images of phase separation by mixing full-length human NEMO with linear polyUb of different lengths as indicated. Right panel: fluorescence intensity quantification of liquid droplets. Shown are means ± SD. n = 4 areas.
In (B), (D), (E), (F) and (G): One-way analysis of variance (ANOVA); n.s., P > 0.0332; ***, P < 0.0002; ****, P < 0.0001.
See also Figure S12.
