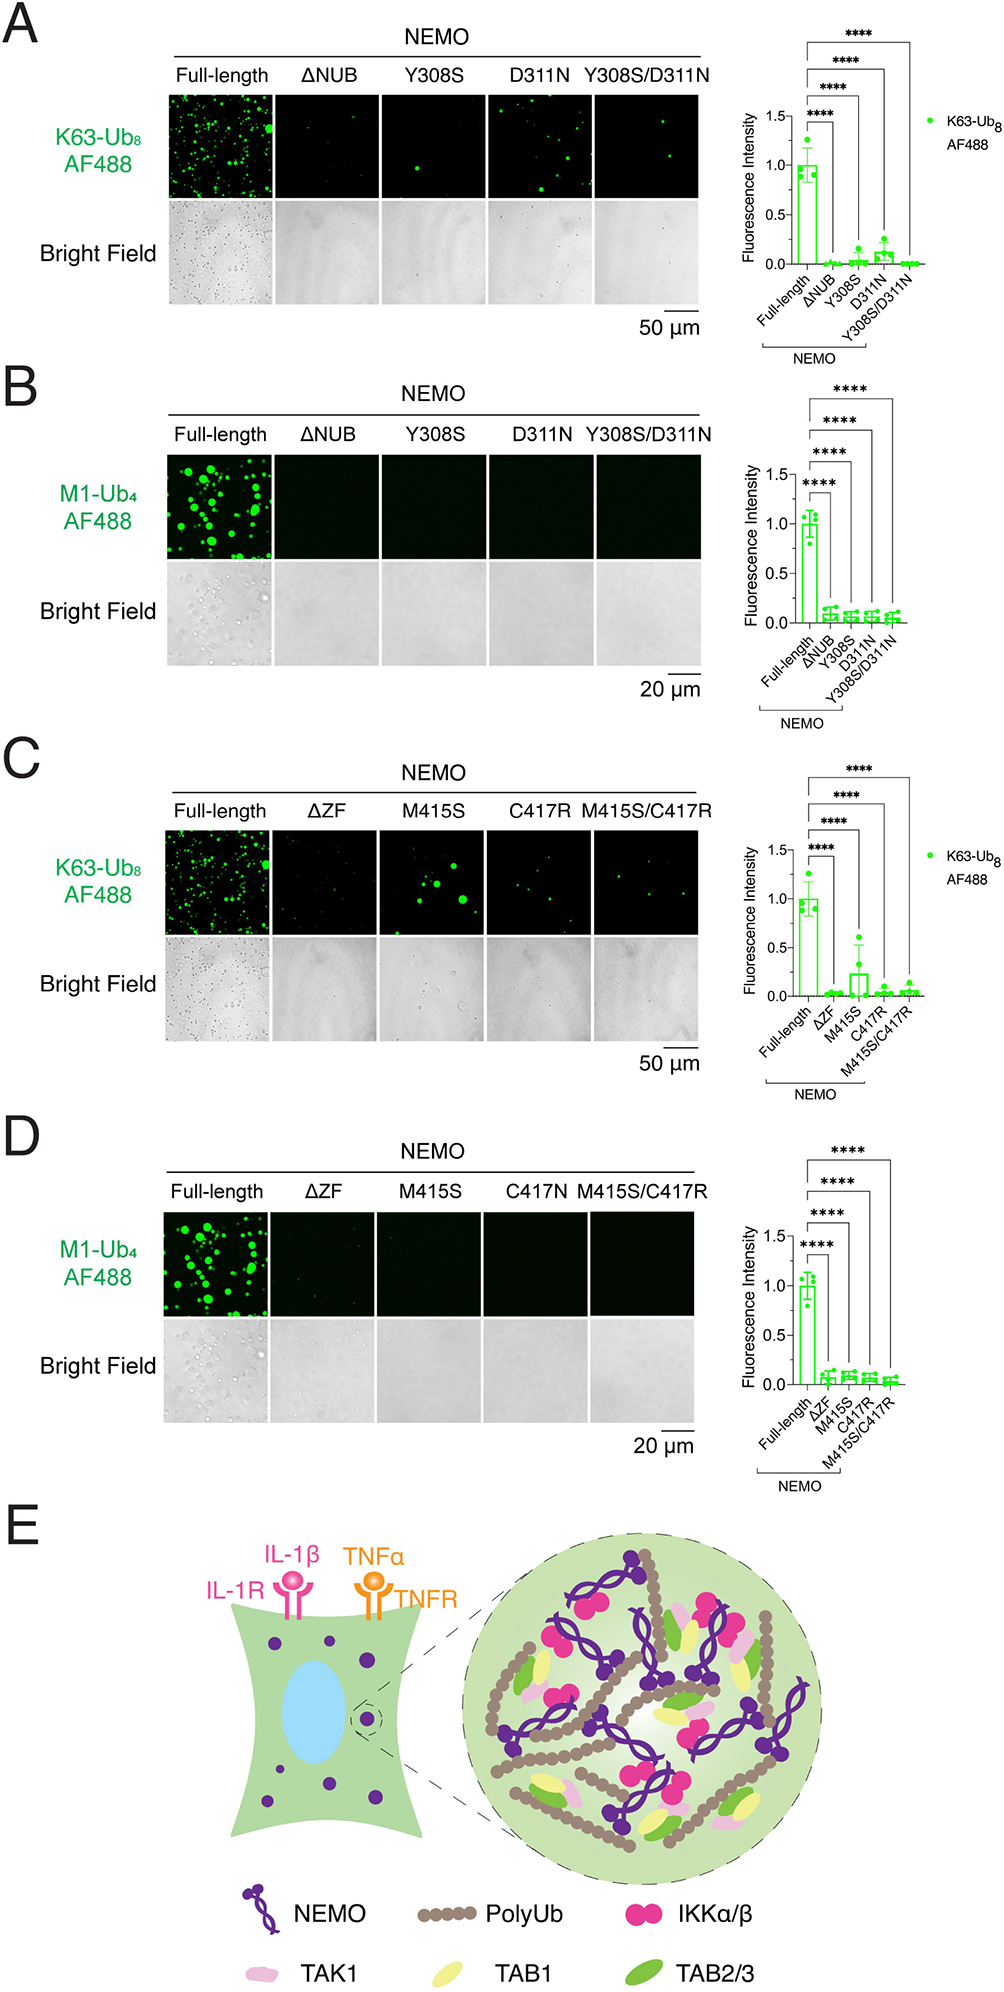
Figure 7. NEMO mutants linked to human diseases are defective in phase separation with polyubiquitin chains.

(A) and (C) Left panel: representative images of phase separation by incubating K63-Ub8 with NEMO or mutants as indicated. Right panel: quantification of fluorescence intensity of liquid droplets. Shown are means ± SD. n = 4 areas. These images are from the same experiment as in Figure 5D.
(B) and (D) Left panel: representative images of phase separation by incubating M1-Ub4 with NEMO or mutants as indicated. Right panel: quantification of fluorescence intensity of liquid droplets. Shown are means ± SD. n = 4 areas. These images are from the same experiment as in Figure 5E.
(E) Schematic of NEMO–PolyUb interactions that drive their liquid phase separation. Stimulation of cells with TNFα or IL-1β leads to the formation of K63-linked and linear polyUb chains that bind to NEMO/IKK and TAB2/TAK1 complex, driving the formation of liquid droplets in which the TAK1 and IKK complexes are condensed and activated.
In (A), (B), (C), and (D): One-way analysis of variance (ANOVA); ****, P < 0.0001.
See also Figure S15 and S16.
