
Extended Data Figure 7. NLRP3 is recruited to dTGN via binding to PI4P.
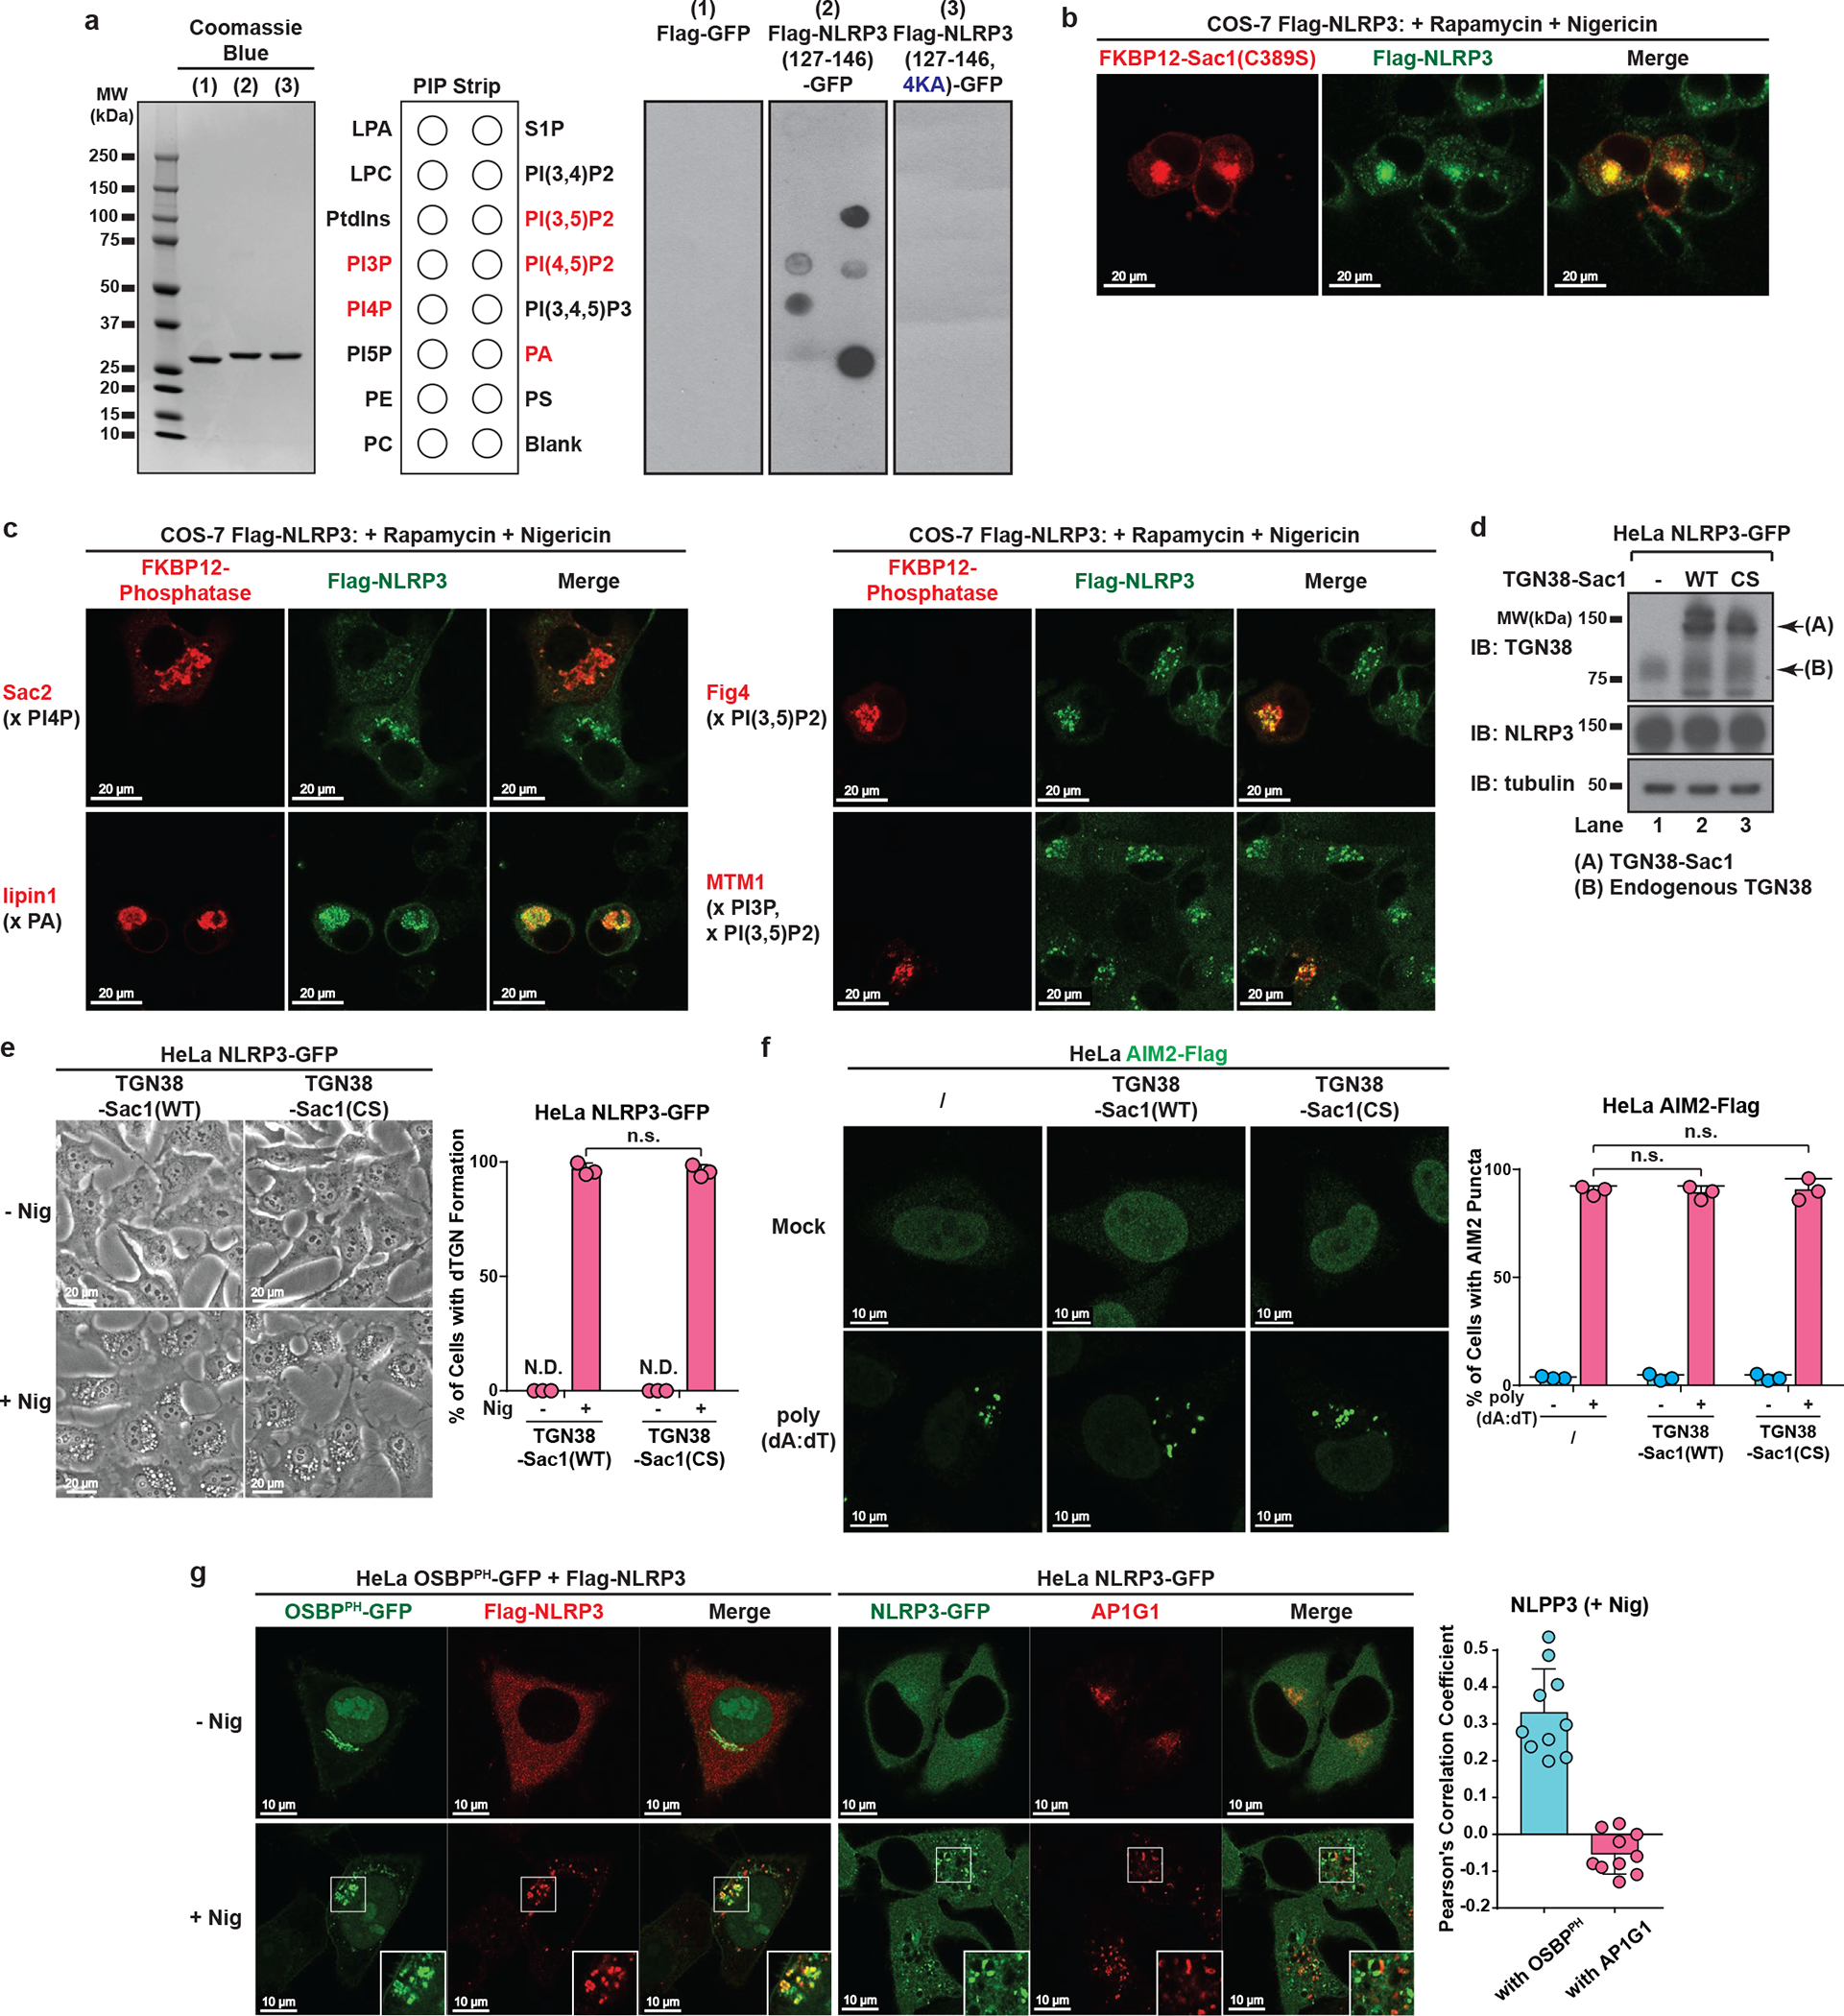
a, The polybasic region of NLRP3 interacted with phospholipids in vitro through its positive charge. Left panel: Coomassie Blue staining of purified proteins of interest, with Flag-GFP as a control. Right panel: PIP Strip membranes blotted with various lipids were incubated sequentially with proteins of interest, Flag antibody and HRP secondary antibody before exposure. Phospholipids with positive binding on the second PIP Strip are highlighted in red. b, Catalytically inactive Sac1 did not impair the recruitment of NLRP3 to dTGN. COS-7 cells stably expressing Flag-NLRP3 were transiently transfected with TGN38-FRB and mRFP-FKBP12-Sac1(C389S), incubated with rapamycin (1 μM) and nigericin (10 μM) for 80 min before imaging. Note that nigericin-induced dTGN in COS-7 cells sometimes look like a single cluster because of the relatively small size of COS-7 cells and the high intensity of fluorescence signal. Under phase contrast microscope these dTGN were separated vesicles adjacent to each other (data not shown). c, Only PI4P phosphatase blocked NLRP3 recruitment to dTGN. Similar to (b), except that indicated phosphatases were used. The target phospholipids are labeled after “x”. d, Immunoblots of HeLa NLRP3-GFP cells stably expressing TGN38-Sac1 (WT or C389S). CS, C389S. e, TGN-targeted Sac1 didn’t affect general cell morphology or nigericin-induced dTGN formation. Cells were treated −/+ nigericin (10 μM) for 80 min before imaged under phase contrast microscope. The percentage of cells with dTGN formation was quantified from 100 cells (n = 3, mean ± SD, two-sided t test). N.D., not detectable. n.s., not significant (alpha = 0.01). f, TGN-targeted Sac1 didn’t affect AIM2 aggregation. Cells stably expressing the indicated proteins were transfected with or without poly(dA:dT) (1.5 μg/mL) for 3 hours before imaging. The percentage of cells with AIM2 aggregates was analyzed as in (e). g, NLRP3 puncta were restricted to PI4P-enriched microdomains. Cells stably expressing the indicated proteins were treated −/+ nigericin (10 μM) for 80 min before imaging. Inset: higher magnification of dTGN. Colocalization analysis was performed by calculating Pearson’s correlation coefficient (threshold regression: Costes) using Coloc 2 plugin of ImageJ. Data are presented as mean ± SD.