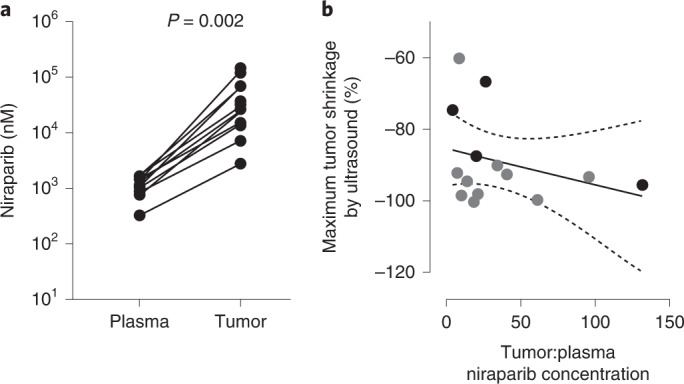
Fig. 2. Niraparib concentration in plasma and tumor and association between reduction in tumor volume and tumor:plasma niraparib concentration.

a, Niraparib concentration in patient plasma and tumor samples collected at the end of cycle 2 of niraparib, day 28 (n = 10 patients with time-matched samples; two-sided Wilcoxon’s matched-pairs, signed-rank test, P = 0.002). One patient in the analysis had a dose reduction to 100 mg before the end of cycle 2. b, Maximum tumor volume reduction based on ultrasound measurement after ≥2 months of niraparib treatment (maximal tumor reduction was −100%) and the fold difference in tumor versus matched plasma niraparib concentration (where available; for patients without available matched plasma samples, the plasma niraparib Cmax value from C2D1 was used instead to estimate the fold difference), using a linear regression model R2 = 0.088; Spearman’s rank correlation (ρ = −0.26, two-sided P = 0.36). The gray dot indicates patients with time-matched tumor and plasma samples (n = 10 patients) and the black dot patients without time-matched plasma samples (n = 4 patients), for whom fold difference in tumor versus plasma niraparib concentration was estimated based on the plasma Cmax. The dashed lines indicate 95% CIs.
