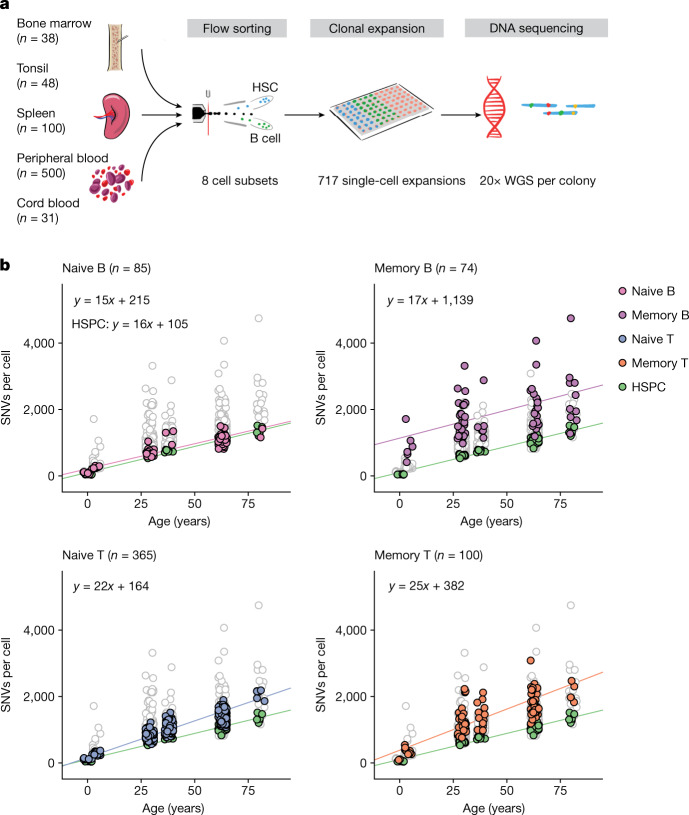
Fig. 1. Experimental design and lymphocyte mutation burden with age.
a, Schematic of the experimental design. WGS, whole-genome sequencing. b, SNV mutation burden per genome for the four main lymphocyte subsets, compared with HSPCs (green points). Each panel shows data for HSPCs and the indicated cell type in colour, with the other three lymphocyte subsets plotted in white with grey outline. The lines show the fit for the indicated cell type using linear mixed-effects models.

