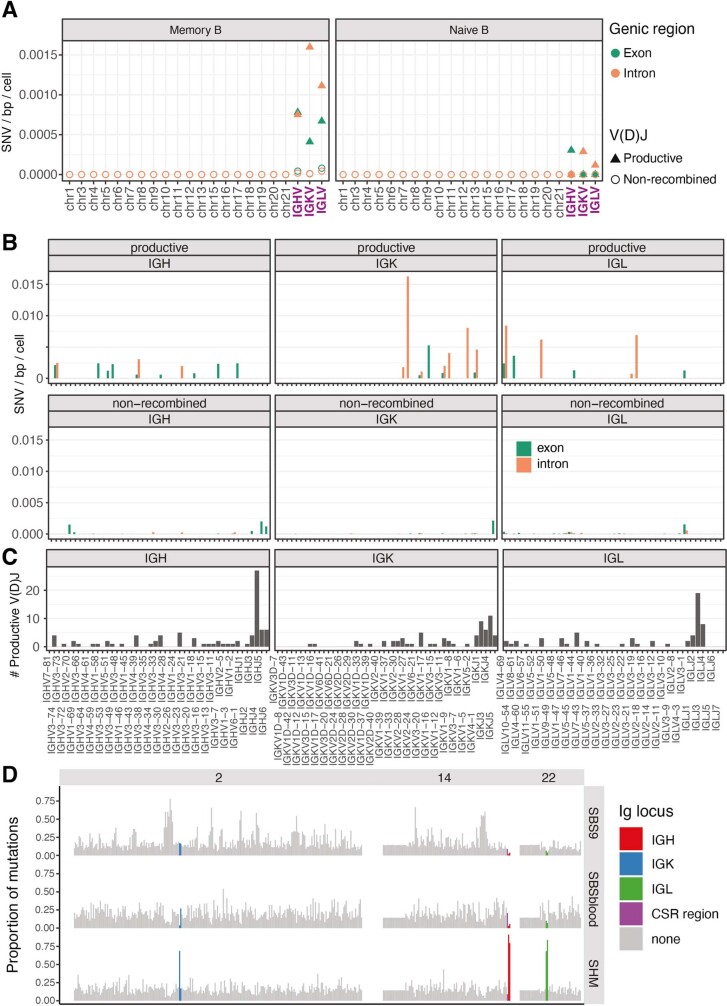
Extended Data Fig. 6. Distribution of mutational signatures across the genome.
(A) Estimates of the mutation rate across non-Ig chromosomes and Ig regions for memory (left) and naive B (right) cells. Rates for the Ig regions are calculated separately for the productive (triangles) and non-recombined alleles (circles) and exons (green) versus introns (orange). (B) Estimated mutation rates across different variable segments of the Ig genes for exons (green) versus introns (orange). (C) Number of productive V(D)J rearrangements affecting each variable segment in the dataset. (D) Proportion of mutations across chromosomes 2, 14 and 22 in each 1Mb window attributed to signatures SBS9, SBSblood and the canonical somatic hypermutation (SHM) signature (rows). Windows spanning the relevant immunoglobulin regions are coloured according to the key.

