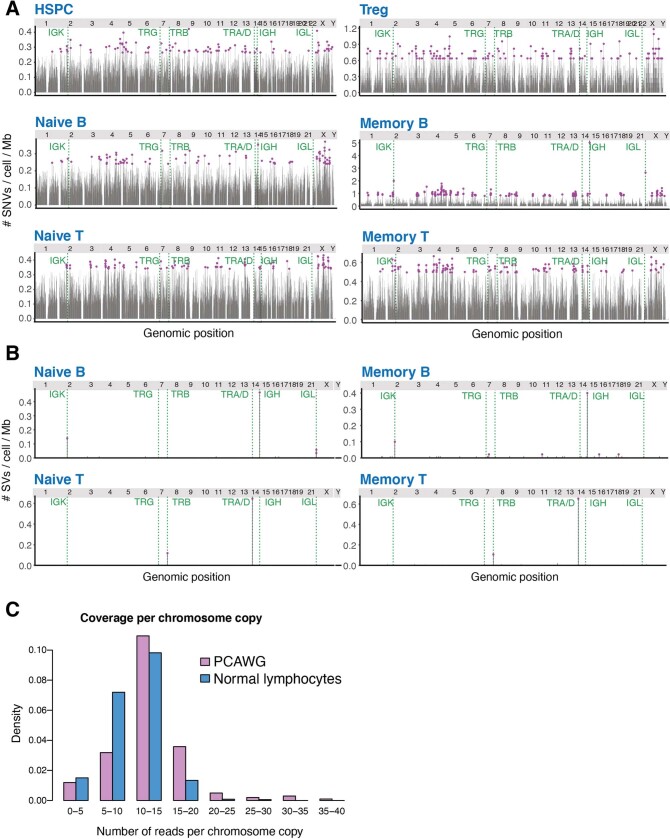
Extended Data Fig. 9. SV density and patterns in normal and malignant lymphocytes.
(A-B) Mutation rates per 1Mb bin across the genome for SNVs (A) and structural variants (B) split by cell type, with chromosomes labelled in the top strip, and Ig/TCR regions marked. Circles (purple) denote bins with more mutations than 2 standard deviations above the mean. (C) Histogram showing the distribution of estimated number of reads per informative chromosome copy for the normal lymphocytes (blue) and lymphoid malignancies from PCAWG (purple). For cancer genomes, purity and ploidy were estimated from the copy number patterns; for lymphocyte colonies, the purity was 1 and ploidy was 2.

