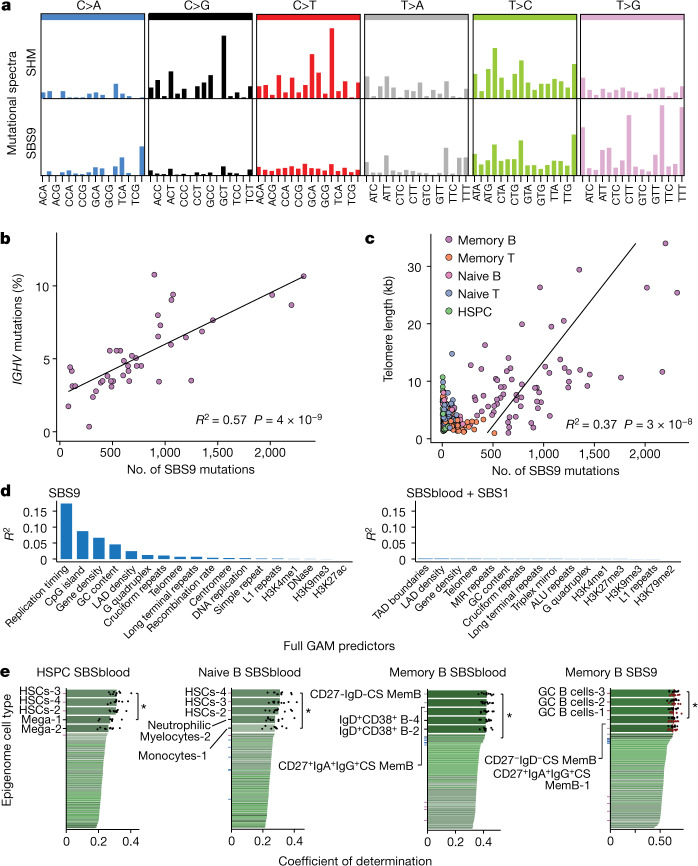
Fig. 3. Correlation of SBS9 with genomic attributes and timing of mutational processes.
a, Mutational spectra of the SBS9 and SHM signatures. Trinucleotide contexts on the x-axis represent 16 bars within each substitution class, divided into 4 sets of 4 bars, grouped by the nucleotide 5′ to the mutated base, and within each group by the 3′ nucleotide. The y-axis shows the number of mutations in each class. b, The number of SBS9 mutations genome-wide and the percentage of bases in IGHV that are mutated in the productive rearrangement of memory B cells. The line represents the linear regression estimate of the correlation. c, Number of SBS9 mutations versus telomere length per genome, coloured by cell type. The regression line is for memory B cells. d, Explanatory power of each significant genomic feature in the generalized additive model (GAM), expressed as the R2 of the individual GAM for predicting number of SBS9 mutations (left) or number of SBSblood or SBS1 mutations (right) per 10-kb window. LAD, lamina-associated domain. e, Performance of prediction of genome-wide mutational distribution attributable to particular mutational signatures from histone marks of 149 epigenomes representing distinct blood cell types and different phases of development (numbers after cell types on y-axis indicate replicates); ticks are coloured according to the epigenetic cell type (purple, HSC; blue, naive B cell; grey, memory B cell; maroon, GC B cell); black points depict values from tenfold cross-validation; P-values for comparison of the tenfold cross-validation values by two-sided Wilcoxon test. CS, class switched; GC, germinal centre; HSC, hematopoietic stem cell; Mem, memory; Mega, megakaryocyte.

