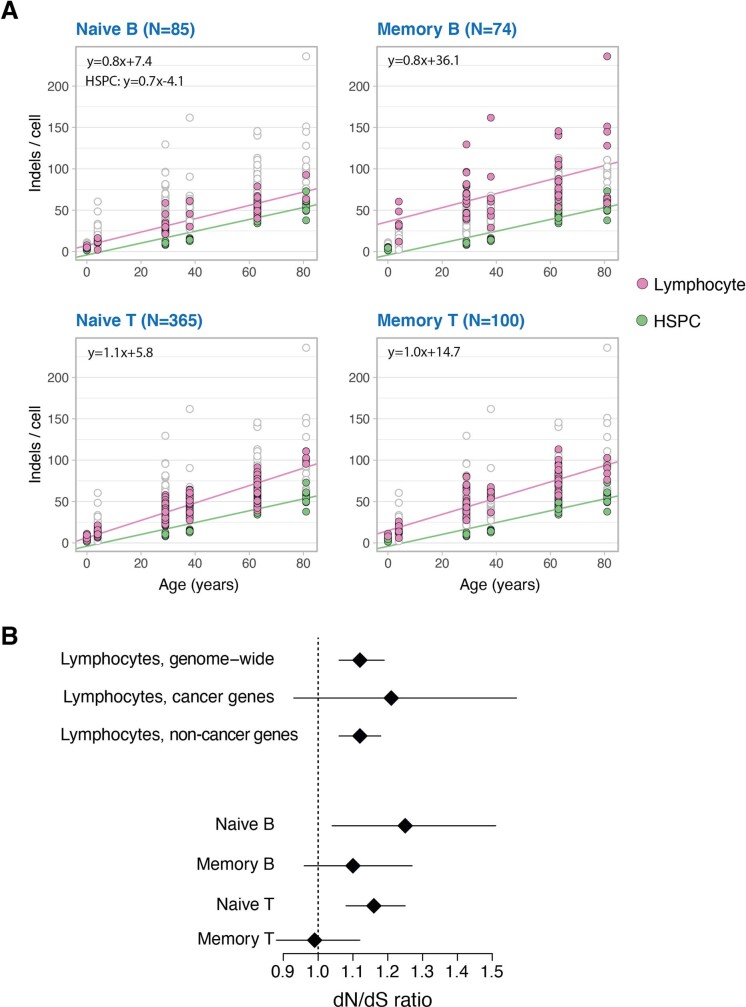
Extended Data Fig. 3. Indels and selection pressure.
(A) Indel mutation burden per genome for the four main lymphocyte subsets (pink points), compared with HSPCs (green points). Each panel has all genomes plotted underneath in white with grey outline. The lines show the fit by linear mixed effects models for the respective populations. (B) Plots of the estimated dN/dS ratio for mutations genome-wide (excluding immunoglobulin genes) for all lymphocytes, and for the various individual lymphocyte populations. The second row shows the estimated dN/dS ratio for known cancer genes in all lymphocytes. The diamond shows the point estimates, and the lines the 95% confidence intervals. The point estimates / number of variants included in each analysis are as follows: lymphocytes, genome-wide = 1.12 / 7555; lymphocytes, cancer genes = 1.21 / 352; naive B = 1.25 / 671; memory B = 1.10 / 1132; naive T = 1.16 / 4162; memory T = 0.99 / 1414.

