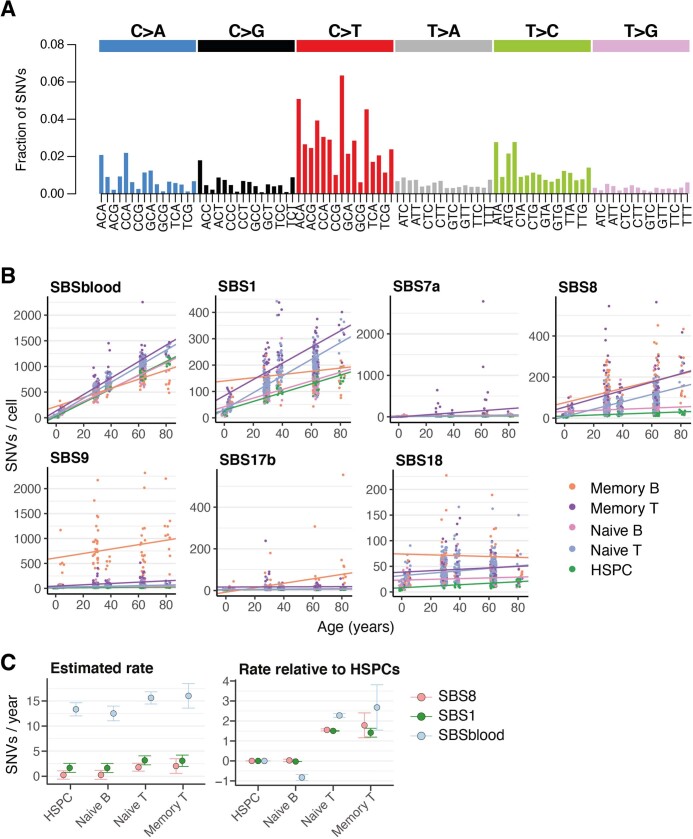
Extended Data Fig. 4. Mutational signatures by age.
(A) SBSblood signature identified using HSPC genomes and the program sigfit. Trinucleotide contexts on the x-axis represent 16 bars within each substitution class, divided into 4 sets of 4 bars, grouped by the nucleotide 5′ to the mutated base, and within each group by the 3′ nucleotide. (B) SNV mutation burden per genome, shown separately for each mutational signature. The lines show the fit by linear mixed effects models for the respective populations. Two outlier cells (PD40667vu and PD40667rx) are excluded from plotting. (C) The rate of mutation accumulation per year (slopes in B) for signatures with strong age effects. Error bars represent the 95% confidence intervals on the slope from the linear mixed effects models.

