
Fig. 1. Live-seq combines optimized FluidFM-based live-cell biopsy with enhanced Smart-seq2 RNA-seq.
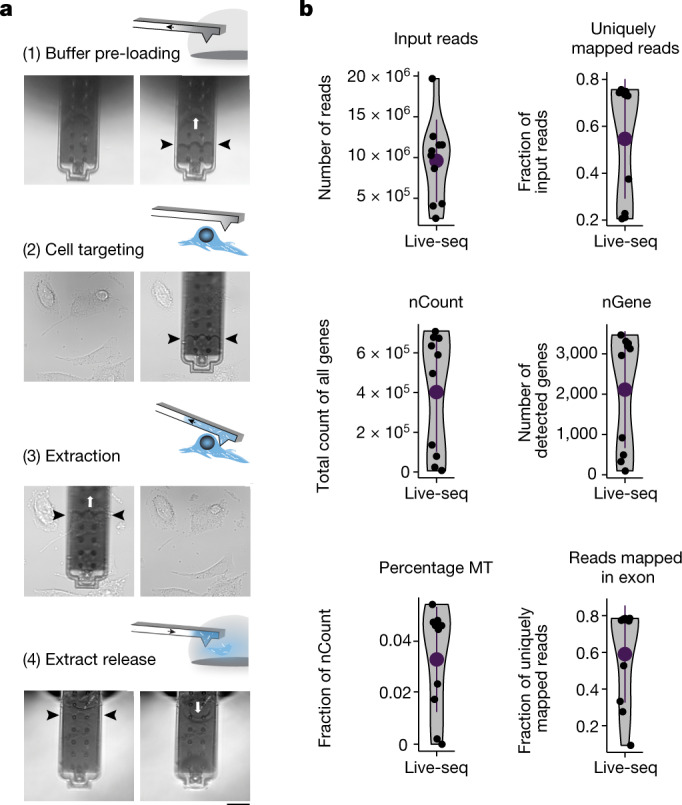
a, Illustration and representative images of the Live-seq sampling procedure using FluidFM (here, applied on brown preadipocyte IBA cells). The white arrows indicate the application of under- or overpressure. The black arrows indicate the amount of buffer and extract in the probe. Scale bar, 20 μm. b, Quality control of Live-seq applied on IBA cells based on the parameters that are listed above each panel. n = 10 cells. nGene, number of detected genes; nCount, total count of all genes; percentage MT, percentage of counts from mitochondrial genes. Error bars represent mean ± s.d.